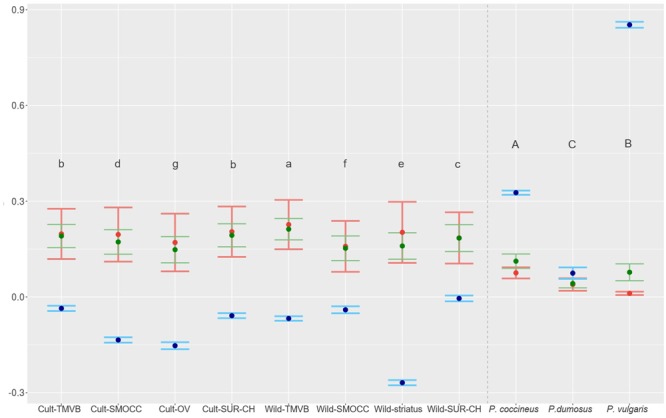
FIGURE 5.

HE in green (variance interval), HO in red (variance interval) and inbreeding coefficient in blue (95% IC) estimated for genetic clusters of P. coccineus and for species of VDC group. Letters show groups that are statistically different and are decreasingly ordered according HE.
