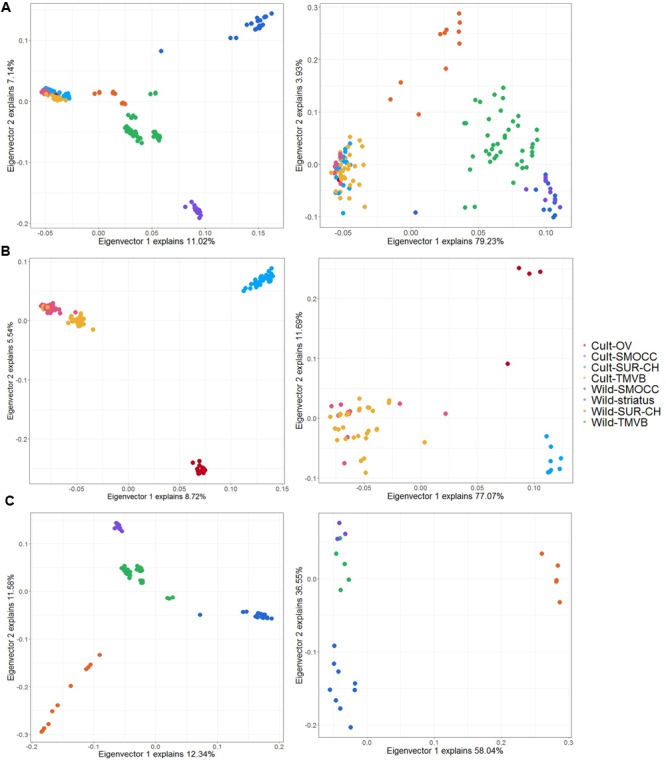
FIGURE 7.

Principal components analysis plot for the first two principal components using LD dataset (left) and candidate SNPs identify in both in PCAdapt and BayeScan analysis (right). (A) Analysis including cultivated and wild samples (no feral) to detect domestication-related SNPs. (B) Analysis of cultivated populations to distinguish cultivar diversification-related loci. (C) Analysis of wild samples to detect signatures of natural selection.
