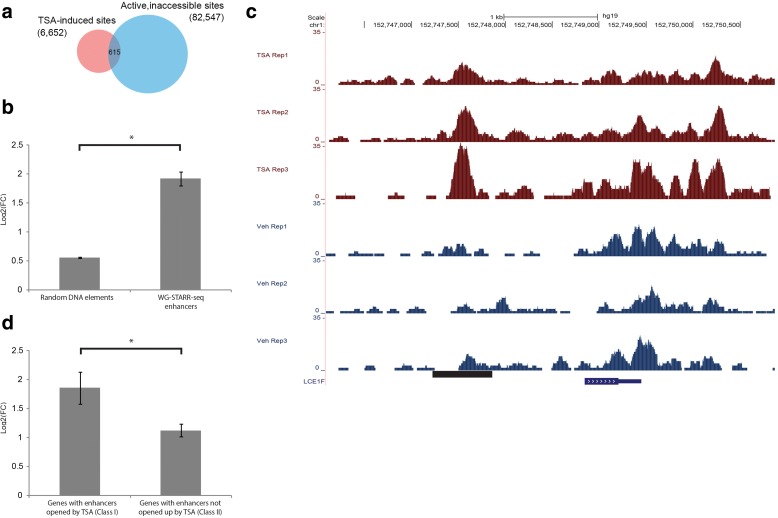
Fig. 3.
Inaccessible enhancers are functional upon treatment with TSA. a Venn diagram showing the overlap between active, inaccessible WHG-STARR-seq enhancers and TSA-induced sites. b Comparison of gene expression in response to TSA treatment of global genes and the 401 genes that have nearby WHG-STARR-seq enhancers which were inaccessible under vehicle treatment but became accessible under TSA treatment. Statistical significance was calculated using Wilcox Sum Rank Test (*p = 2.2e-16). c Genomic snapshot displaying ATAC-seq signal at LCE1F locus of LNCaP cells treated with TSA vs vehicle. d Comparison of nearby gene expression in response to TSA treatment of WHG-STARR-seq enhancers that were previously inaccessible, but opened up by TSA treatment (Class I) and regions not active in WHG-STARR-seq and opened up by TSA (Class II). Statistical significance was calculated by Wilcoxon sum rank test (*p = 1.6e-2)

