
Fig. 2.
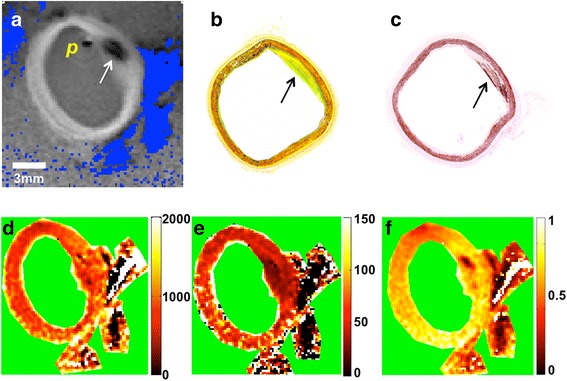
(a) Dixon lipid image (blue) overlaid on a gradient-echo vessel wall image, with (b) Movat and (c) Van Kossa histology results from the vessel section post-exam (arrows, calcified lesion; ‘p’ is near the probe location). Color-coded T1 (d), T2 (e), and PD (f) maps, below, were acquired using the Four-FA method [35]. Relaxation time scales (right) are in ms, PD is the fraction relative to water, and green denotes masking