
Fig. 5.
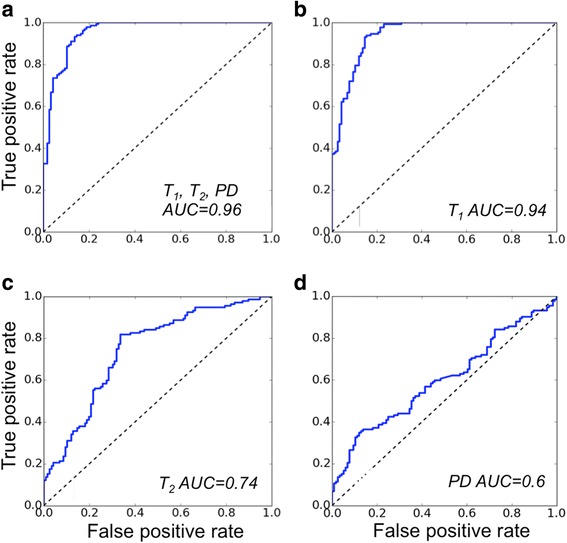
ROC curves of the classifier for distinguishing diseased and healthy tissue based on: (a) all three parameters, T1, T2 and PD; (b) T1 only, (c) T2, only and (d) PD only. Areas under the curves (AUCs) are 0.96, 0.94, 0.74 and 0.6 respectively
Official websites use .gov
A
.gov website belongs to an official
government organization in the United States.
Secure .gov websites use HTTPS
A lock (
) or https:// means you've safely
connected to the .gov website. Share sensitive
information only on official, secure websites.
ROC curves of the classifier for distinguishing diseased and healthy tissue based on: (a) all three parameters, T1, T2 and PD; (b) T1 only, (c) T2, only and (d) PD only. Areas under the curves (AUCs) are 0.96, 0.94, 0.74 and 0.6 respectively