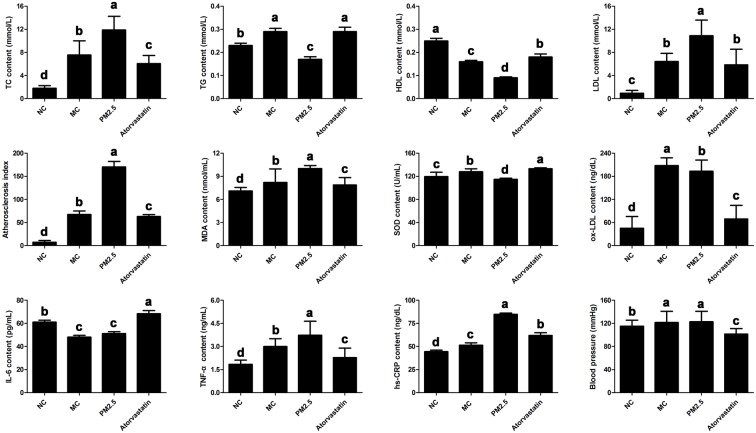
Figure 1.
Comparison of biochemical variables among four groups, including normal control group (NC), model control group (MC), model PM2.5 group (PM2.5) and model atorvastatin group (Atorvastatin). Error bars correspond to the standard deviation of the mean ± SD of three replicates. The letters above the bars indicate a statistically significant difference (p < 0.05) between groups with different letters and no difference between groups with the same letters.

