Figure 5.
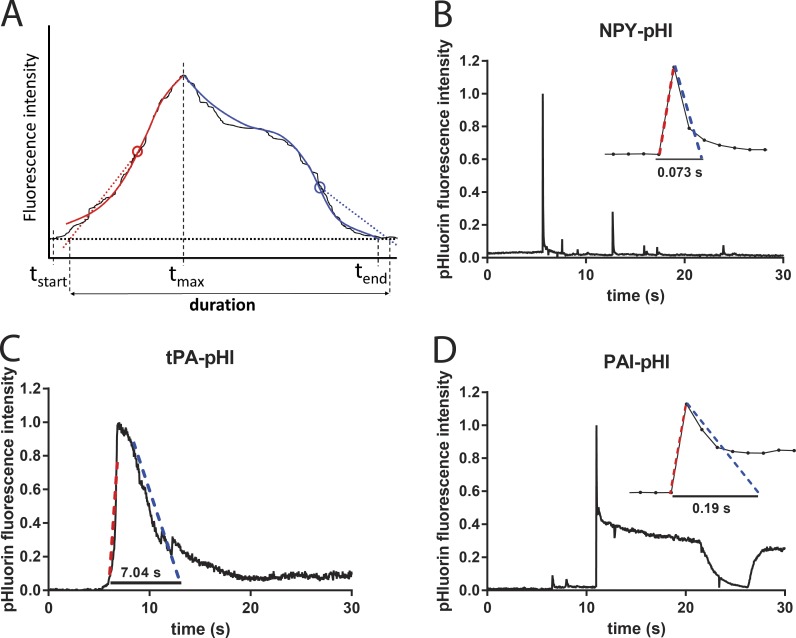
NPY, tPA, and PAI have different secretion characteristics. Bovine chromaffin cells were transfected to express cargo proteins fused to pHl. Secretion was stimulated with 56 mM potassium buffer and observed by TIRF microscopy at a rate of 36 Hz. pHl fluorescence intensity was analyzed with a custom duration-finding program that is robust against variations in the shape of the data curve. (A) Schematic of program features. The solid thin black curve is the noisy fluorescence versus time of hypothetical data. A start time tstart is chosen, at which the fluorescence is defined to be baseline. Analysis is done separately for the rising phase (red) and the falling phase (blue), defined as before or after the fluorescence maximum time tmax, respectively. First, the fluorescence versus time in each phase is smoothed by fitting to a fifth-degree polynomial (thick red or blue solid lines). Next, a weighted average slope is calculated for each phase in the respective time windows (tstart, tmax) and (tmax, tend). Straight lines with those slopes (shown as dotted lines) are pinned to the maximum slope points (denoted by circles) and then extrapolated to the baseline to determine the event duration. (B) NPY-pHl is secreted rapidly. Entire events frequently take less than five frames at 36 Hz (inset; each point is one frame). Although the analysis was performed on a region of interest encompassing only the largest (first) fluorescent change, fluorescence changes from nearby fusion events are also evident. (C) tPA-pHl is secreted slowly, frequently lasting many seconds. (D) PAI-pHl is secreted rapidly. Often, ∼50% of PAI-pHl fluorescence is immediately lost, over just a few frames (inset). A fraction of PAI-pHl remains on the cell surface (plateau) and is sensitive to a pH 5.5 solution applied extracellularly.

