Figure 8.
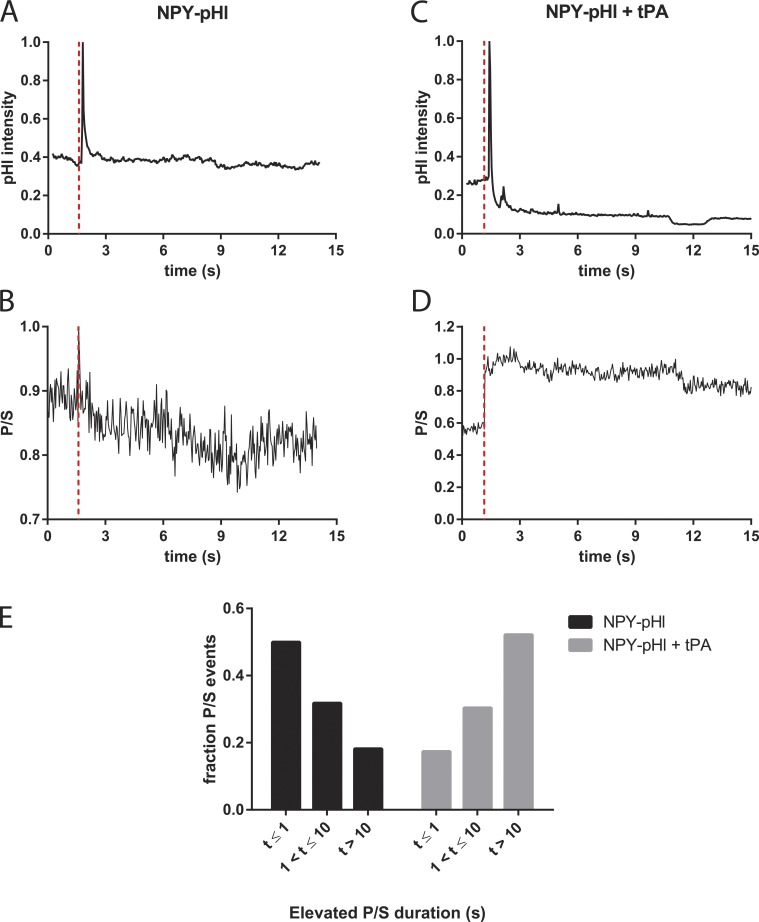
tPA slows fusion pore expansion in the presence of NPY-pHl. Bovine chromaffin cells were cotransfected with either NPY-pHl and pcDNA3 or NPY-pHl and tPA. pTIRF microscopy was performed as described in Materials and Methods. (A and C) Changes in pHl fluorescence were recorded over time. (B and D) Concurrently, DiD fluorescence as excited by P- and S-polarized light was recorded. The ratio P/S, plotted against time, corresponds to localized increases in membrane curvature. Secretion start time is indicated by the dotted red line. (E) Increases in P/S are reported semiquantitatively. The length of time P/S was elevated was measured for n = 22 NPY-pHl + pcDNA3 or n = 33 NPY-pHl = tPA events and binned as shown.

