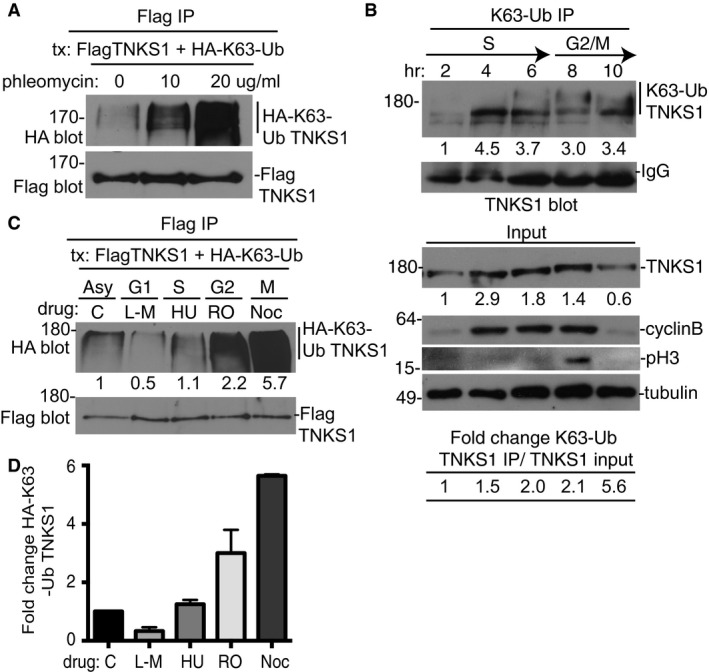
Figure 4. K63‐linked polyubiquitination of tankyrase 1 is cell cycle‐regulated.

-
AK63‐ubiquitination of tankyrase 1 occurs without exogenous damage, but can be stimulated by double‐strand breaks. HTC75 cells were cotransfected with FlagTNKS1 and HA‐K63‐Ub, treated with 0, 10, or 20 μg/ml phleomycin for 4 h prior to harvest, immunoprecipitated with anti‐Flag antibody, and immunoblotted with anti‐Flag or HA antibodies.
-
BK63‐ubiquitination of tankyrase 1 is dependent upon cell cycle progression. HeLa cells were synchronized by a double thymidine block, released, and collected every 2 h. Whole‐cell extracts were immunoprecipitated with anti‐K63‐Ub antibody and analyzed by immunoblotting with anti‐TNKS1 antibody. Protein levels of K63‐Ub TNKS1 relative to IgG and normalized to the 2‐h time point are indicated below the blot. Immunoblot analysis of input samples with the indicated antibodies is shown below. Protein levels of TNKS1 relative to tubulin and normalized to the 2‐h time point are indicated below the blot. The fold change of immunoprecipitated K63‐Ub TNKS1 relative to input TNKS1 is indicated at the bottom.
-
C, DHA‐K63‐linked polyubiquitinated FlagTNKS1 is high in S/G2/M and diminished in G1 phase. (C) HTC75 cells were cotransfected with FlagTNKS1 and HA‐K63‐Ub and synchronized by addition of L‐mimosine (G1), hydroxyurea (S) R03306 (G2), or nocodazole (M). Cell extracts were immunoprecipitated with anti‐Flag and immunoblotted with anti‐Flag or HA antibodies. Protein levels of HA‐K63‐Ub TNKS1 relative to FlagTNKS1 and normalized to the asynchronized (asy) control are indicated below the blot. (D) Graphical representation of the fold change. Average of two independent experiments ± SEM.
Source data are available online for this figure.
