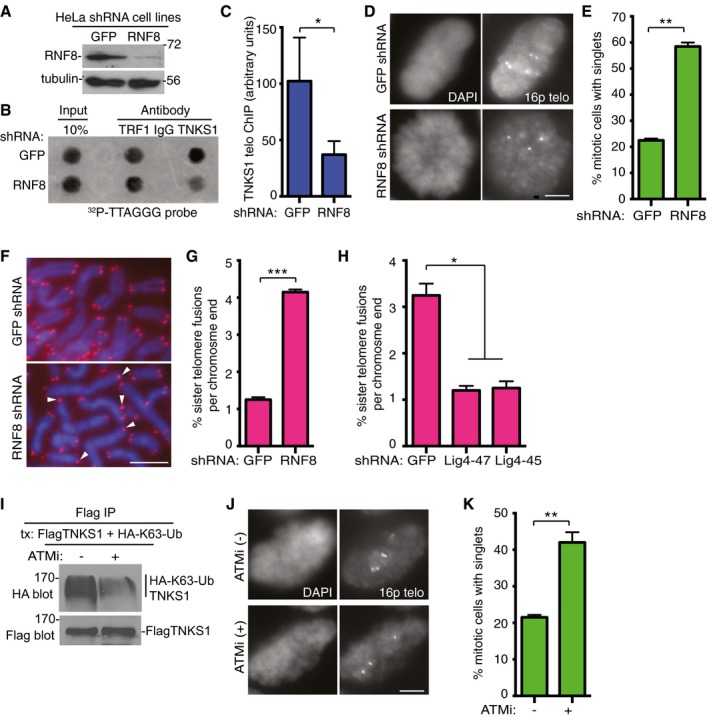
Figure 5. RNF8 is required for binding of tankyrase 1 to telomeres and for timely resolution of telomere cohesion.

-
A–CTankyrase 1 association with telomeres is reduced in RNF8‐depleted cells. (A) Immunoblot analysis of HeLaI.2.11 cell lines stably expressing GFP or RNF8 shRNA. (B) Telomeric DNA ChIP analysis of GFP or RNF8 shRNA HeLaI.2.11 cell lines using the indicated antibodies. (C) Quantification of the signal intensity of telomeric DNA immunoprecipitated by anti‐TNKS1 antibody. Average of three independent experiments ± SD. *P ≤ 0.05; Student's unpaired t‐test.
-
D, EResolution of telomere cohesion depends on RNF8. (D) Mitotic cells were isolated from HeLaI.2.11 cell lines stably expressing GFP or RNF8 shRNA by mitotic shake‐off and subjected to FISH analysis with a 16ptelo probe. Scale bar, 5 μm. (E) Graphical representation of the frequency of mitotic cells with cohered telomeres. Average of two independent experiments (n = 60 cells each) ± SEM. **P ≤ 0.01; Student's unpaired t‐test.
-
F, GRNF8 depletion leads to sister telomere fusions. (F) Telomere FISH analysis with a (CCCTAA)3 repeat probe (red) of metaphase spreads from GFP or RNF8 shRNA HTC75 cell lines. DNA was stained with DAPI (blue). White arrowheads indicate sister telomere fusions. Scale bar, 5 μm. (G) Graphical representation of the frequency of sister telomere fusions per chromosome end. Average of two independent experiments (n = 756–1,012 chromosome ends each) ± SEM. ***P ≤ 0.001; Student's unpaired t‐test.
-
HDNA ligase IV depletion rescues sister telomere fusions in RNF8 shRNA cells following infection with GFP or Lig4 (47 or 45) shRNA lentivirus. Graphical representation of the frequency of sister telomere fusions per chromosome end. Average of two independent experiments (n = 702–1,072 chromosome ends each) ± SEM. *P ≤ 0.05; Student's unpaired t‐test.
-
IInhibition of ATM reduces K63‐Ub chains on tankyrase 1. HeLaI.2.11 cells were cotransfected with FlagTNKS1 and HA‐K63‐Ub, treated with or without the ATM inhibitor (ATMi) KU‐55933 for 4 h prior to harvest, immunoprecipitated with anti‐Flag, and immunoblotted with anti‐Flag or HA antibodies.
-
J, KInhibition of ATM reduces resolution of telomere cohesion. (J) HeLaI.2.11 cells were isolated by mitotic shake‐off following 4‐h treatment with or without ATMi and subjected to FISH analysis with a 16ptelo probe. Scale bar, 5 μm. (K) Graphical representation of the frequency of mitotic cells with cohered telomeres. Average of two independent experiments (n = 60 cells each) ± SEM. **P ≤ 0.01; Student's unpaired t‐test.
Source data are available online for this figure.
