
Figure 2. Transcription of genes involved in ribosome biogenesis peaks in the G1 phase.
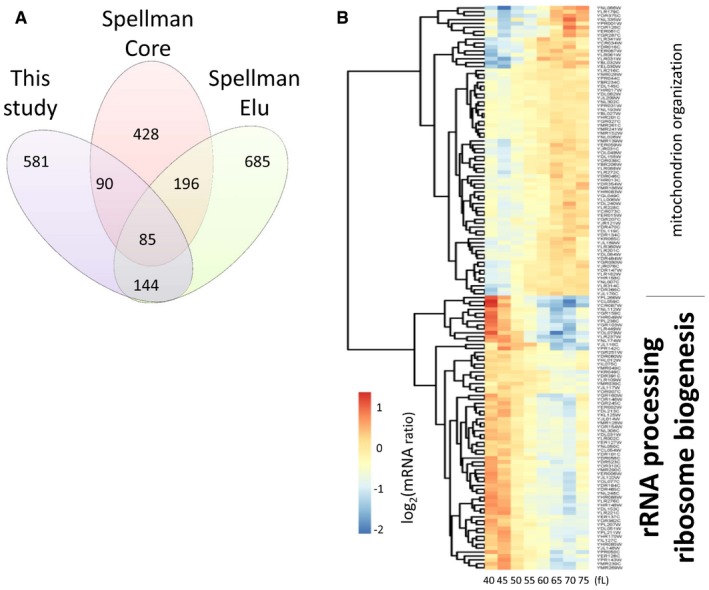
- Venn diagram showing the number of cell cycle‐regulated transcripts in the following datasets: The “Spellman Core” dataset was defined by Spellman et al (1998), based on an “aggregate CDC score” from multiple experiments that did not include the elutriation dataset that Spellman and colleagues performed (Spellman et al, 1998). The “Spellman Elu” dataset includes all the cell cycle‐regulated transcripts we identified by analyzing the microarray elutriation experiment of Spellman et al (1998), as we described in the Materials and Methods. Our dataset (Dataset 1 within the Source Data for this figure), “This study”, from the elutriations shown in Fig 1 was analyzed exactly as the “Spellman Elu” set.
- Heatmap of the mRNA levels of the 144 genes (Dataset 2 within the Source Data for this figure) in common between the “Spellman Elu” and “This study” datasets. The enriched Gene Ontology terms highlighted on top (P = 0.001), or bottom (P = 6.0E‐23), were calculated with the DAVID software tool (Huang et al, 2007), or the YeastMine platform (Balakrishnan et al, 2012), respectively.
Source data are available online for this figure.