
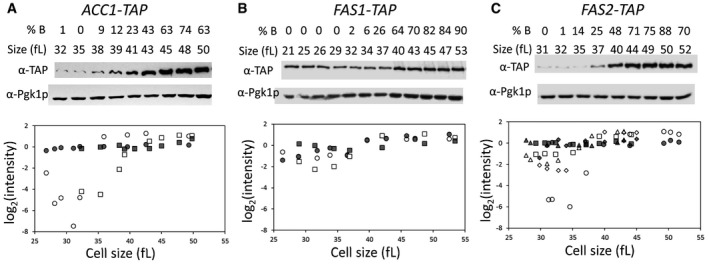
Figure 4. Protein abundance of Acc1p, Fas1p, and Fas2p in the cell cycle.
-
A–CEarly G1 daughter cells of cells carrying C‐terminal TAP‐tagged alleles of ACC1 (A), FAS1 (B), or FAS2 (C) at their endogenous chromosomal locations were collected by elutriation and allowed to progress synchronously in the cell cycle. At the indicated cell sizes (fl) and budding index (% B), the abundance of the proteins shown was queried by immunoblotting (see Materials and Methods). Representative images of the immunoblots are shown on top, with the cells size (in fl) and the percentage of budded cells (% B) shown in each case. The graphs at the bottom display the band intensities for each independent experiment (indicated with different open symbols; see Source Data for the corresponding immunoblots), plotted on the y‐axis as the log2 values of their expressed ratios (see Materials and Methods), against the corresponding cell size (x‐axis). Experiment‐matched loading controls (filled symbols) were also quantified and shown in parallel.
Source data are available online for this figure.