
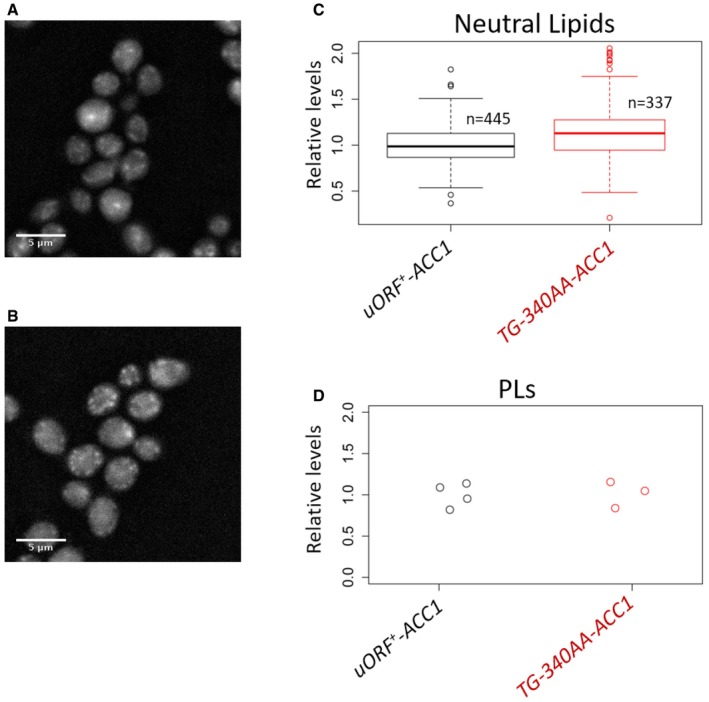
Figure EV4. Lipid droplet and phospholipid content of ACC1 uORF mutant cells in glycerol medium.
-
A, BRepresentative images to visualize lipid droplets using fluorescence microscopy of wild‐type (A) or ACC1 uORF mutant cells (B) proliferating exponentially in poor medium, with glycerol as carbon source. In all microscope images, 5 μm scale bars are indicated.
-
CQuantification of the lipid droplet (Neutral Lipids) staining from (A and B), displayed with box‐plots, normalized for the values of the “uORF + ‐ACC1” sample. The median and the inter‐quartile range are indicated, along with the number of cells examined in each case. The whiskers extend to 1.5 times the interquartile range.
-
DStrip chart showing the quantification of total phospholipid (PLs) content from the same cell populations shown in (A–C), normalized for the values of the “uORF + ‐ACC1” sample.