
Figure 6. Cells lacking the uORF upstream of ACC1 proliferate slower and are smaller in glycerol media.
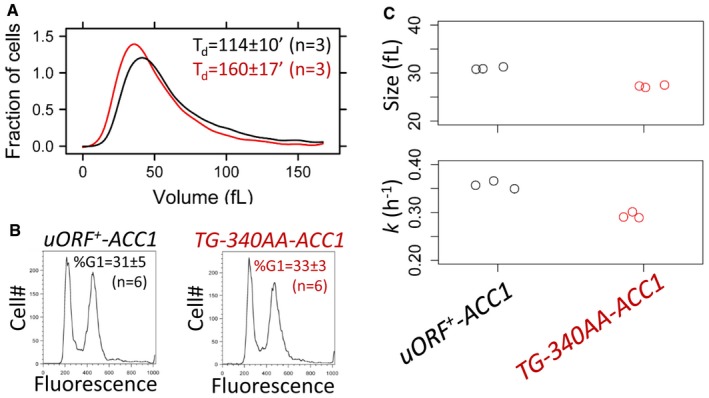
- Representative size histograms of the wild‐type (shown in black) and TG‐340AA‐ACC1 (shown in red) cell populations cultured in YPGlycerol medium was measured using a channelyzer. Cell numbers are plotted on the y‐axis, and the x‐axis indicates cell volume (in fl). The average doubling time (T d) of the same cultures (n = 3) is shown in each case (average ± s.d.).
- Representative DNA content histograms of wild‐type (shown in black) and TG‐340AA‐ACC1 (shown in red) cell populations cultured in YPGlycerol were obtained with flow cytometry. Cell numbers are plotted on the y‐axis, and the x‐axis indicates fluorescence per cell. The average percentage of cells with a G1 DNA content (%G1) of the same samples (n = 6) is shown in each case (average ± s.d.).
- Strip charts showing the critical size (top) and specific rate of size increase (bottom) of the indicated strains obtained from elutriated synchronous cell populations growing in YPGlycerol medium.