
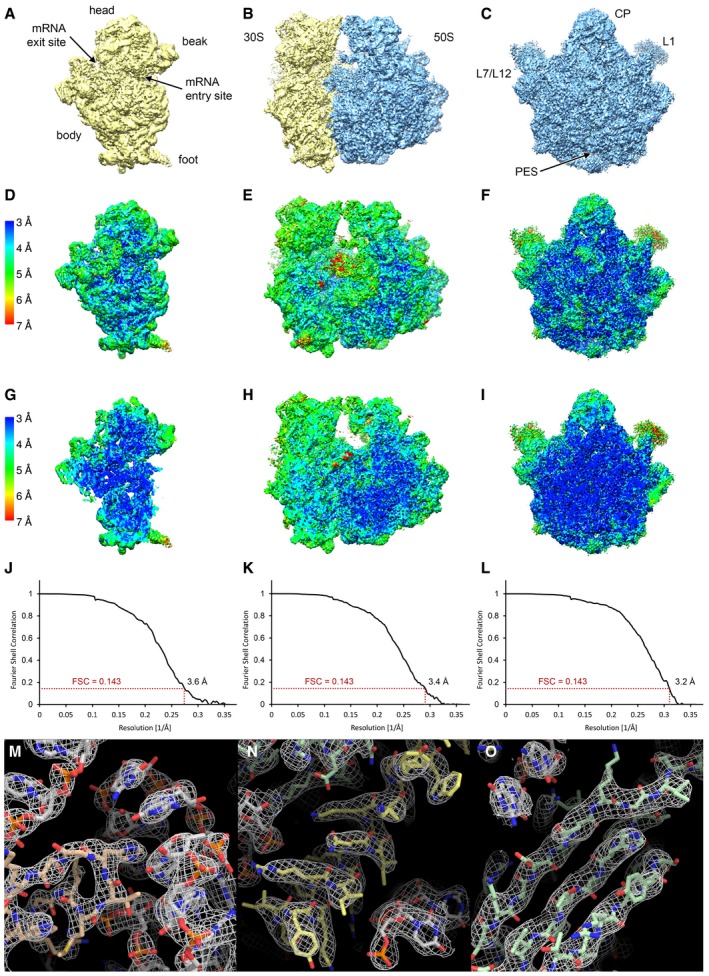
Figure EV1. Resolution and quality of the cryo‐EM reconstructions.
-
A–CSurface rendering of the final high‐resolution maps of the 30S subunit (A), the 70S ribosome (B) and the 50S subunit (C).
-
D–ILocal resolution plots showing the surface (D–F) and a cross section (G–I) of the cryo‐EM maps. Local resolution maps of the 30S (D, G), 70S (E, H) and 50S (F, I) are shown from the same view as in panels (A, B and C), respectively.
-
J–LFourier shell correlation (FSC) curves of the 30S (J), the 70S (K) and 50S (L) cryo‐EM reconstructions. The indicated resolutions are according to the FSC = 0.143 criterion (“gold‐standard”).
-
M–OExamples for the quality of the density: (M) ribosomal protein (salmon) interacting with rRNA (grey), (N) protein α‐helix (yellow) and (O) protein β‐sheet (green).