Figure 2.
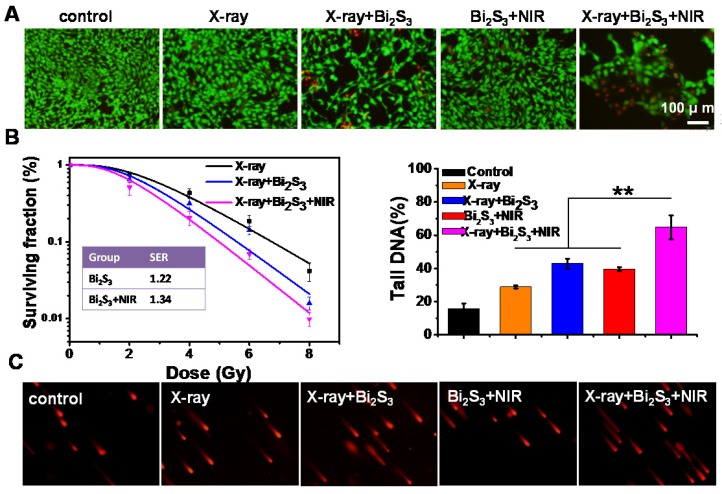
In vitro enhanced radiation therapy combined with photothermal treatment. (A) Representative fluorescence images of live (green) and dead (red) cells with various treatments. (B) Clonogenic survival assay of cells treated with X-ray alone, X-ray plus Bi2S3 nanorods, and X-ray plus Bi2S3 nanorods combined with NIR irradiation under a series of radiation doses of 0, 2, 4, 6, and 8 Gy. (C) Imaging of DNA fragmentation using comet assay in 4T1 cells with different treatments. Histograms correspond to quantification of tail DNA (%). The data are the means and standard deviation from three parallel experiments. More than 50 comets were analyzed in each experiment. P values were calculated by the student's test: **p < 0.01.

