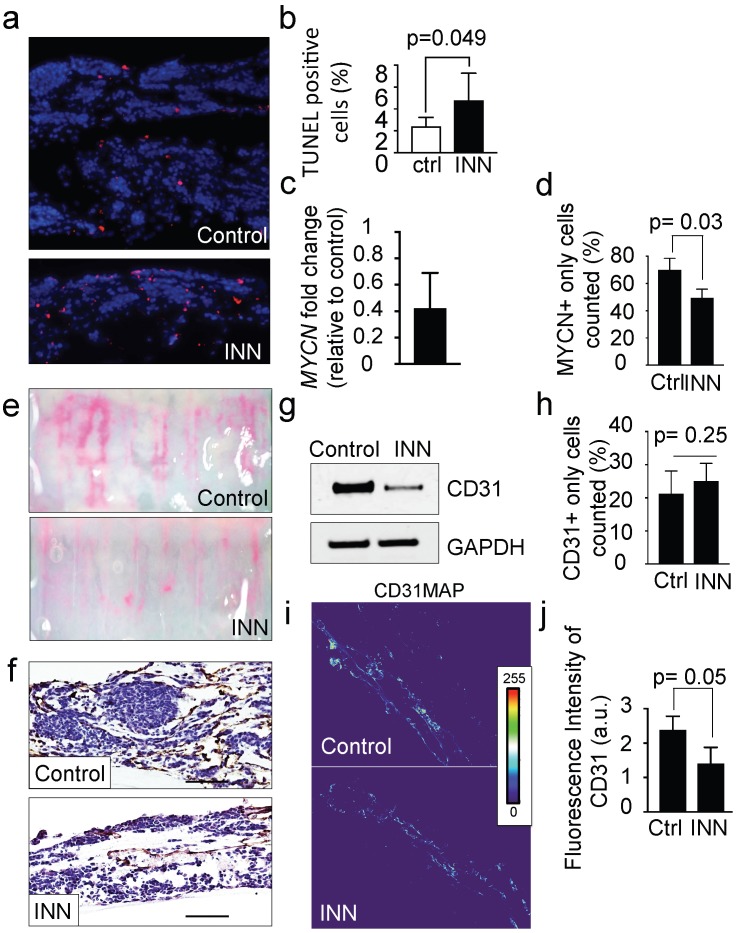
Figure 4.
Effect of isotretinoin (INN) on apoptosis and cell proliferation in the tumor model. (a) Fluorescence images showing apoptotic cells by TUNEL assay (red) in untreated controls and treated tumor models (TE-NB) after 5 days; nuclei are stained with Hoechst 33342 (blue). (b) Percentage of apoptotic cells under indicated conditions (ctrl=control; INN=isotretinoin), by TUNEL assay and counted using the ImageJ software. Statistical significance was determined by the two-tailed Student's t test. (untreated controls, n=3; drug treated samples, n=3). (c) mRNA levels measured by qRT-PCR of MYCN from TE-NB samples treated with INN. mRNA levels were normalized to those observed in untreated samples (n=3 per group). (d) Quantification of the effect of INN on the numbers of neuroblastoma MYCN+ only cells. Double-staining for CD31+/MYCN+ and immunofluorescence was performed as in Figure 3b. Total number of cells and NB cells expressing only MYCN were counted in 4-8 different fields per sample with the total of >1000 cells/sample that were counted for each condition. Data are shown as average ± SD (n=3). (e) Macroscopic analysis of the effects of isotretinoin on tumor vasculature using FluoSpheres Polystyrene Microspheres (in magenta) (untreated control, n=3; drug treatment, n=3), at day 5. (f) Representative images of CD31 staining of tumor models with and without drug treatment, at day 5. Counterstaining with hematoxylin QS (blue) (Scale bar: 100 µm). (g) Protein levels of CD31 in untreated control tumors and drug treated tumors by Western blot analysis. (h) Quantification of the effect of INN on HUVEC (CD31+ only cells) number. Staining and counting of CD31+ cells were performed as in d, and the percentage of cells expressing CD31+ only is shown. (i) Heatmaps of CD31 expression levels (CD31MAPs) in controls and INN treated samples. CD31MAPs were generated by applying ImageJ's Thermal LUT to stacked confocal immunofluorescence images stained for CD31. (j) Fluorescence intensity of CD31 quantified from CD31MAPs by ImageJ in the indicated groups. Total number of cells and NB cells expressing only MYCN+ were counted in 4-8 different fields per sample, with the total >1000 cells/sample counted for each condition. Data are shown as Average ± SD (n=3).

