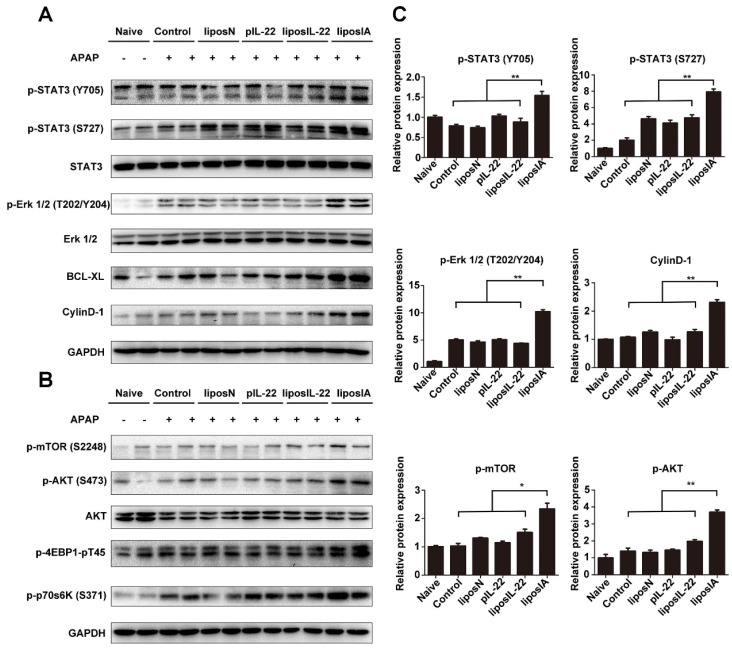
Figure 5.
LiposIA activated hepatic STAT3/Erk and AKT/mTOR signaling transductions. (A) Total liver extracts were prepared and subjected to western blot analysis with various antibodies as indicated. (B) The expression levels of p-mTOR (S2448), p-AKT (S473), p-p70s6K (S371) and p-4EBP1-pT45 were analyzed by western blot. (C) Densitometric values were quantified and normalized to naive group (n = 3; mean ± SD; *P < 0.05, **P < 0.01). The values of naive group were set to 1.

