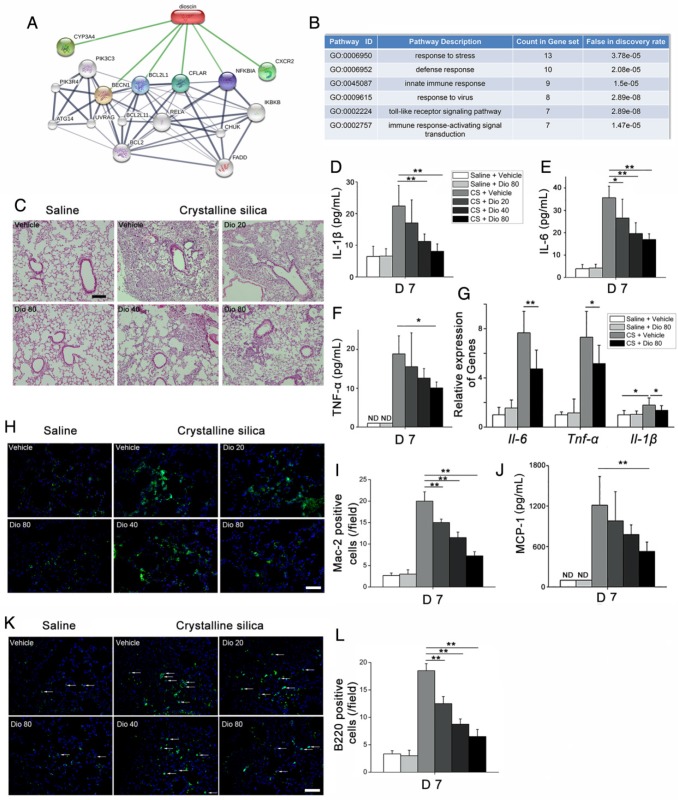
Figure 2.
CS-induced pulmonary inflammatory responses were alleviated by dioscin. (A) Bioinformatics analysis: chemical-protein interaction network in STITCH v.5.0. A screenshot from STITCH shows a network associated with dioscin. (B) Gene Ontology (GO) analysis of biological processes. (C) Lung sections of dioscin-treated mice for 7 d were stained with H&E. Representative images are shown (n=4-5 per group) Scale bar indicates 200 μm. (D-F) ELISA analysis of IL-1β, IL-6, and TNF-α in BALF of dioscin-treated mice for 7 d (n=5-6 per group). ND, not detected. (G) qPCR analysis of Il-6, Il-1β, and Tnf-α mRNA levels in the lung tissues of dioscin-treated mice for 7 d (n=6 per group). (H) Mac-2-positive macrophages were detected by immunofluorescence analysis of the lung sections (green). Nuclei were visualized with DAPI (blue). (I) Quantification of Mac-2 positive cells in lung sections (n=3-4 per group). (J) CBA analysis of MCP-1 in BALF of dioscin-treated mice for 7 d (n=5 per group). (K) B220-positive B cells were detected by immunofluorescence analysis of the lung sections (green). Nuclei were visualized with DAPI (blue) (n=3-4 per group). (L) Quantification of B220 positive cells in lung sections (n=3-4 per group). White arrows indicate positive staining. The lung sections used in (H, K) were from different mice treated for 7 d. Scale bar indicates 100 μm in H, K. *, P<0.05; **, P<0.01; the experiments were performed three times. Error bar indicates mean ± SD.

