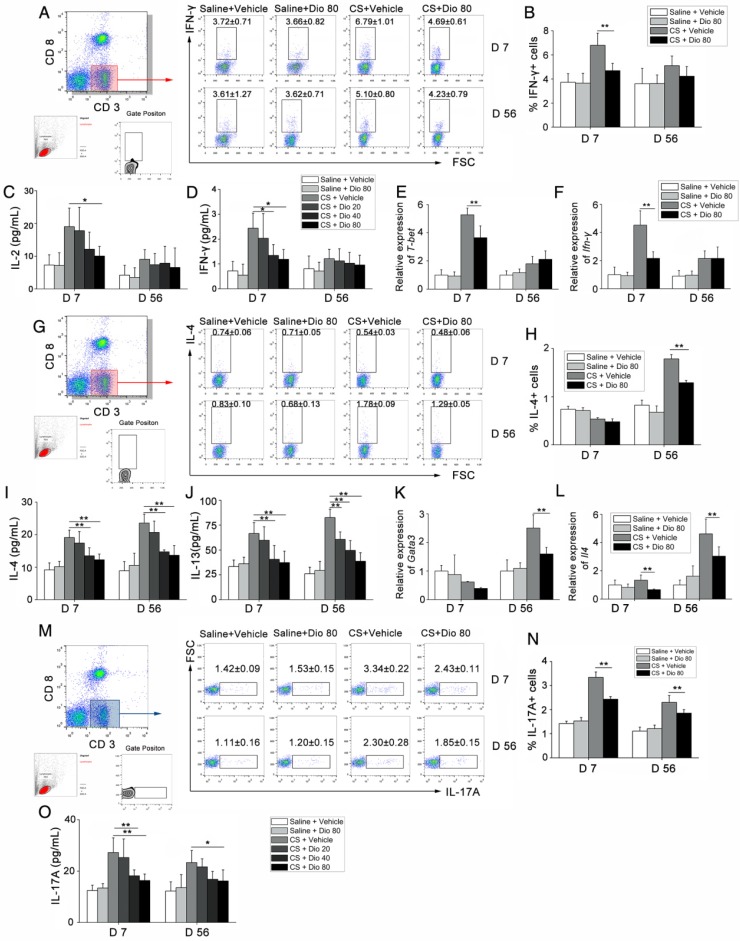
Figure 3.
T helper cell immune responses were influenced by dioscin in the mouse model of CS-induced fibrosis. (A, B) Percentage of CD3+CD8-(CD4+) cells expressing IFN-γ (Th1 cells) in hilar lymph nodes was assayed by FACS analysis (n=5 per group). (C, D) ELISA analysis of IL-2 and IFN-γ in BALF (n=5 per group). (E, F) qPCR analysis of T-bet and IFN-γ in the lung tissues (n=5 per group). (G, H) Percentage of CD3+CD8-(CD4+) cells expressing IL-4 (Th2 cells) in hilar lymph nodes was assayed by FACS analysis (n=4-5 per group). (I, J) ELISA analysis of IL-4 and IL-13 in BALF (n=5 per group). (K, L) qPCR analysis of GATA3 and Il-4 in the lung tissues (n=5 per group). (M, N) Percentage of CD3+CD8-(CD4+) cells expressing IL-17 (Th17 cells) in hilar lymph nodes was assayed by FACS analysis. (n=5 per group). (O) ELISA analysis of IL-17 in BALF (n=5 per group). Gating strategy is shown in the figure. *, P<0.05; **, P<0.01; the experiments were performed twice with similar results. Error bar indicates mean ± SD.

