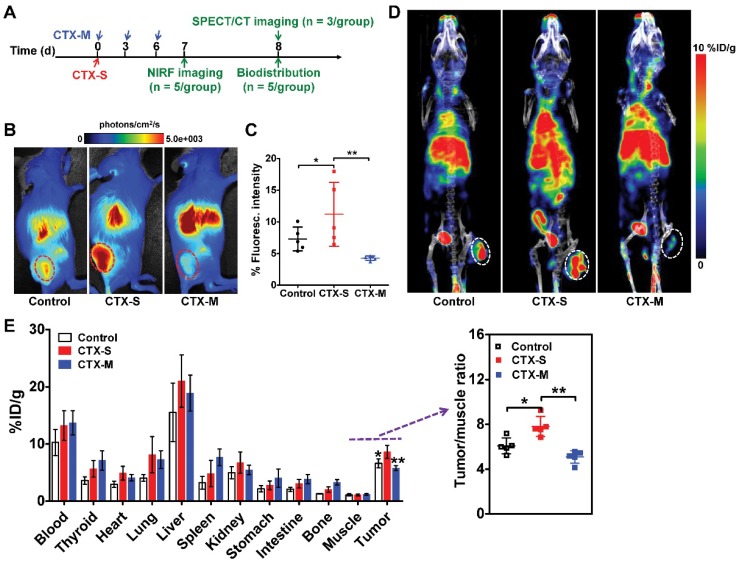
Figure 2.
Significantly increased uptake of Dye-αCD206 and 125I-αCD206 in 4T1 tumors treated with a single dose of CTX, as determined by NIRF and SPECT/CT imaging. (A) Schedule of NIRF and SPECT/CT imaging. (B-C) Representative NIRF images (B) and quantified tumor uptake (C) of control (PBS), CTX-S (single dose, 150 mg/kg) and CTX-M (multiple doses, 75 mg/kg, every 3 days, three times) treated mice 24 h after Dye-αCD206 injection (n = 5 per group). (D) Representative SPECT/CT images of control, CTX-S-, and CTX-M-treated mice 24 h after 125I-αCD206 injection. (E) Biodistribution of 125I-αCD206 in major organs and tumors (n = 5 per group). Inset, results of the tumor-to-muscle ratios of 125I-αCD206. Tumors are indicated with circles. *, P <0.05; **, P <0.01.

