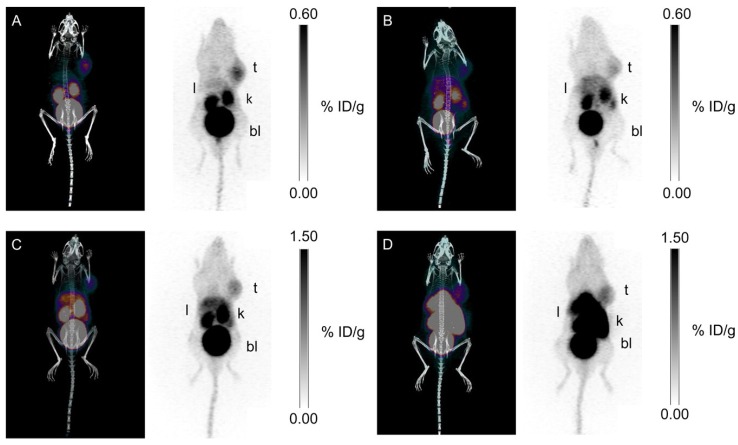
Figure 7.
Maximal intensity projection images of PET/CT and PET with 68Ga tracers at 1 h p.i. (A) 68Ga-DOTA-AEBSA; (B) 68Ga-DOTA-AEBSA preblocked with 10 mg/kg of acetazolamide; (C) 68Ga-DOTA-(AEBSA)2; (D) 68Ga-NOTGA-(AEBSA)3. Tumour uptake was observed for all three compounds with 68Ga-DOTA-AEBSA displaying highest contrast. t = tumour; l = liver; k = kidney; bl = bladder. Adapted with permissions from Lau et al.87 Copyright 2016 American Chemistry Society.

