Figure 3.
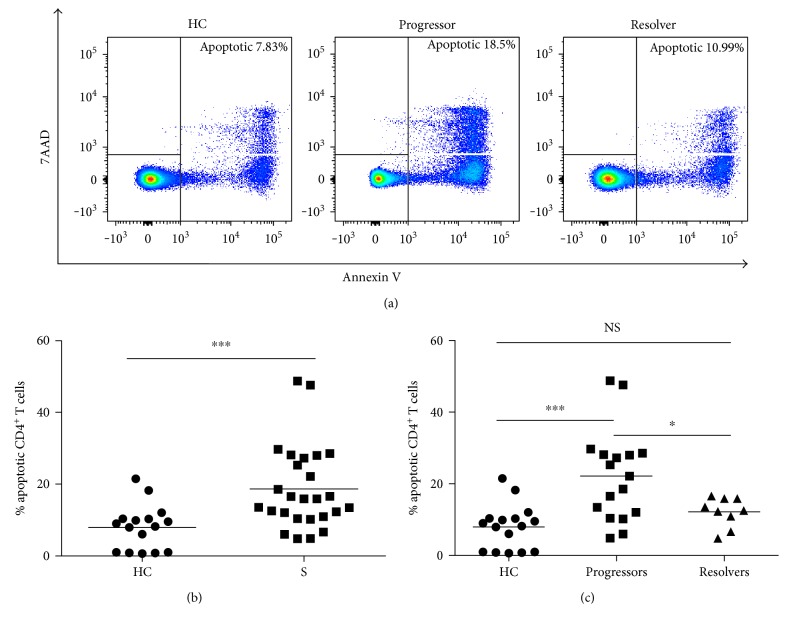
Increased spontaneous apoptosis in sarcoidosis CD4+ T cells. CD4+ T cells were sorted from healthy control (HC) and sarcoidosis (S) PBMC and stained at baseline with apoptosis biomarkers, Annexin V and 7AAD. Flow cytometry was conducted, and FlowJo software was used to gate on apoptotic cells. (a) Representative flow cytometry histograms illustrating the gating strategy used to determine the population of apoptotic cells. (b) Plot of healthy control and sarcoidosis apoptosing CD4+ T cells. Statistical analysis was performed using the Mann–Whitney U test. (c) Plot of healthy control versus sarcoidosis progressor and resolver apoptosing CD4+ T cells. Statistical analysis was performed using one-way ANOVA with Tukey's HSD. Horizontal lines represent mean percentages of apoptosing CD4+ T cells. ∗p < 0.05 and ∗∗∗p < 0.001. NS: not significant.

