
Figure 3.
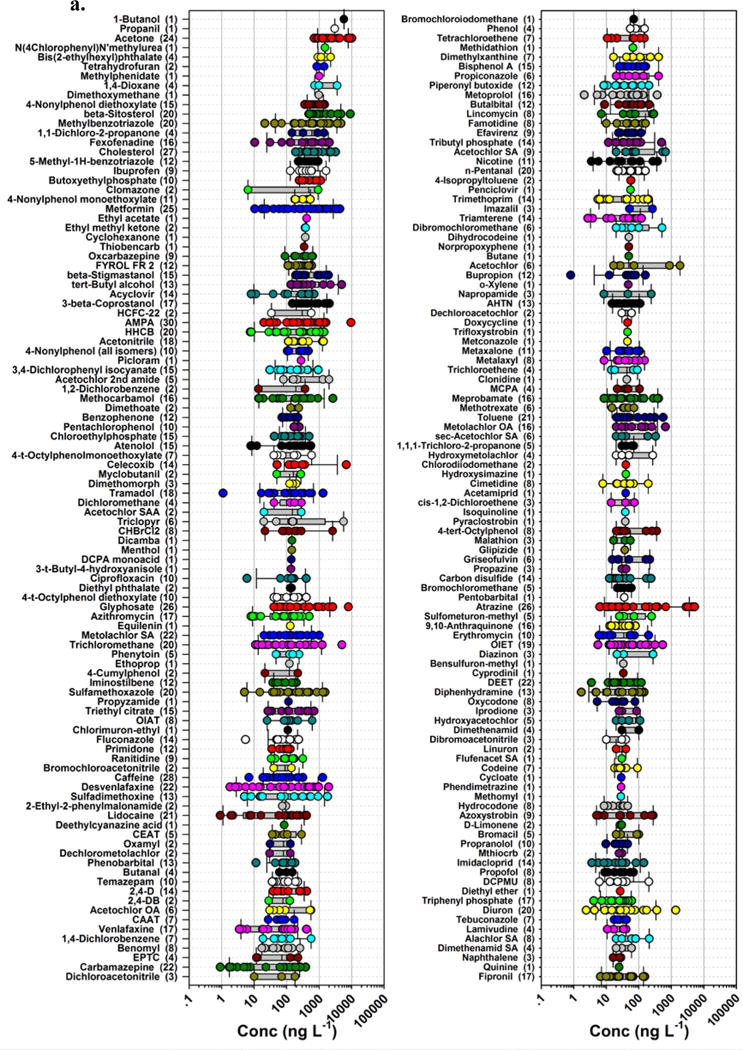
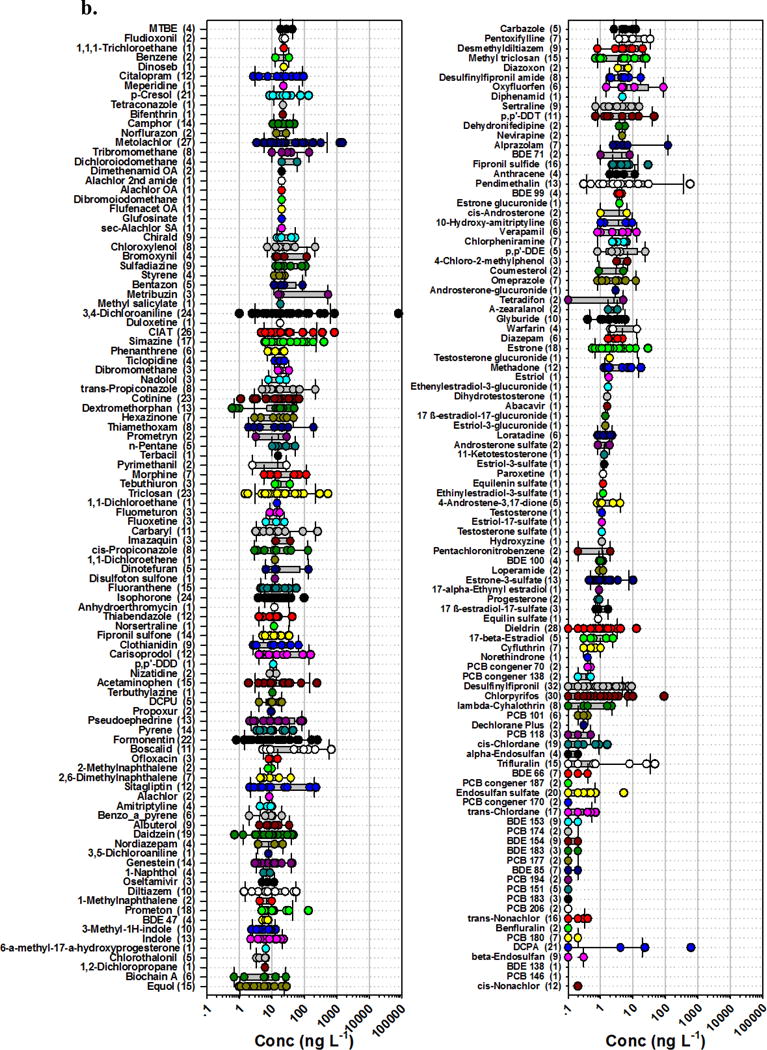
Detected concentrations (circles, ng L−1) and number of sites (in parentheses) for 389 organic analytes (in order of decreasing median detected concentration, top to bottom left to right: 3a. 1–200; 3b. 201–389) in water samples during 2012–2014 sampling of 38 streams across the nation. Circles are data for individual samples. Boxes, centerlines, and whiskers indicate interquartile range, median, and 5th and 95th percentiles, respectively.