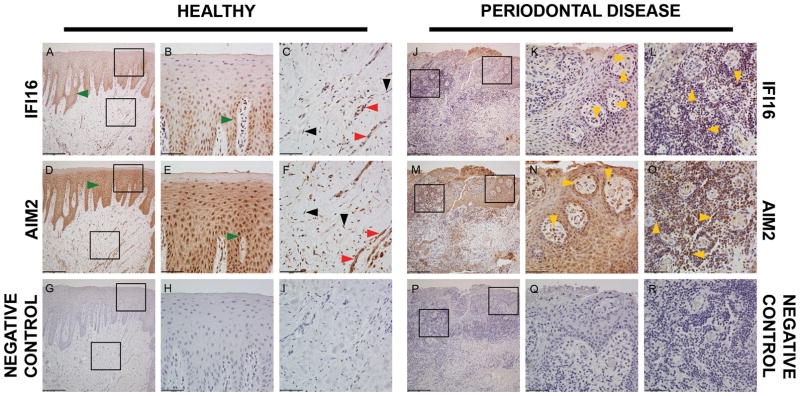
Figure 1.
Immunohistochemical detection of IFI16 and AIM2 in human gingival tissues. Representative images of tissue sections from a healthy individual (A–I) and an individual with periodontal disease (J–R) according to the ADA/AAP classification. stained with the indicated antibodies (left and right rows). A, D, G, J, M, P represent 10× magnification (scale bar = 200.00μm); B, C, E, F, H, I, K, L, N, O, Q, R represent 40× magnification (scale bar = 50.00μm) of the square inserts located in the figures with 10× magnification in the epithelial layer and connective tissue layer. Bottom row are negative controls. Green arrows=epithelial cells; black arrows=fibroblasts; yellow arrows=leukocytes; red arrows=endothelial cells.

