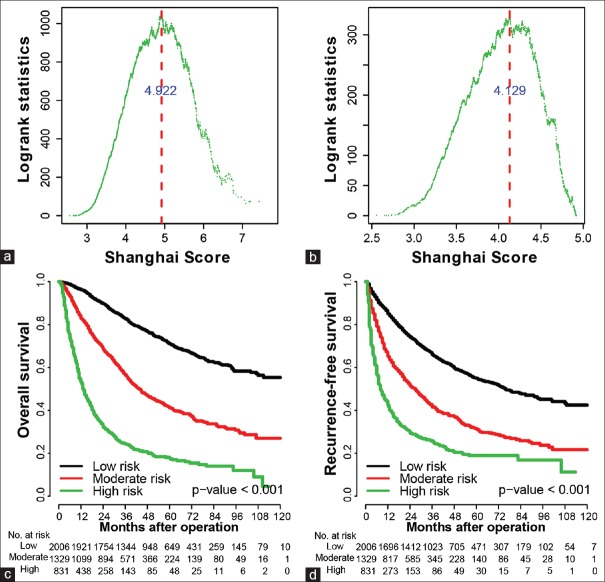
Figure 2.
Identification of the cutoffs at which patients in Cohort 1 can be classified into different groups using the Shanghai Score. (a) The log-rank statistics distribution between groups based on different cutoffs. A Shanghai Score cutoff of 4.922 identified two groups (higher and lower) with the overall survival difference reaching the maximum. (b) The log-rank statistics distribution among lower risk patients. A Shanghai Score cutoff of 4.129 subtyped the lower risk patients into moderate- and low-risk patients, with the overall survival difference between the two groups reaching the maximum. (c and d) Kaplan–Meier curves for overall survival and recurrence-free survival according to the Shanghai Score.

