
Figure 3.
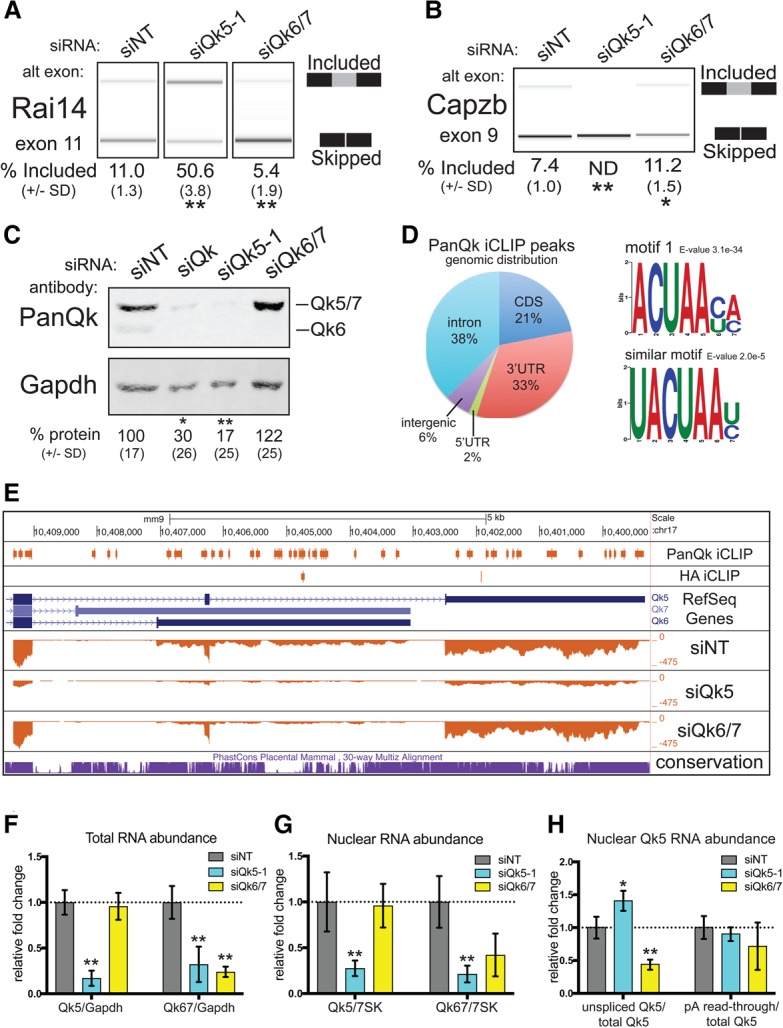
Qk5 is required for splicing and Qk5 and Qk6 accumulation. (A) RT–PCR products from endogenous Rai14 exon 11 analyzed on a Bioanalyzer from RNA extracted from C2C12 myoblasts transfected with siNT, siQk5-1, and siQk6/7. The mean percentage included from three biological replicates ± standard deviation is shown below. (**) P < 0.01. (B) RT–PCR products from the Dup-Capzb exon 9 splicing reporter analyzed on a Bioanalyzer from RNA extracted from C2C12 myoblasts transfected with siNT, siQk5-1, and siQk6/7. The mean percentage included from three biological replicates ± standard deviation is shown below. (**) P < 0.01; (*) P < 0.05. (C) Representative Western blot of protein extracted from C2C12 myoblasts transfected with siNT, siQk, siQk5-1, and siQk6/7 probed simultaneously with anti-PanQk and anti-Gapdh (the notation at the right shows the migration pattern of Qk protein isoforms). The mean relative percentage protein abundance from three biological replicates ± standard deviation is shown below. (**) P < 0.01; (*) P < 0.05. (D) The percentage of iCLIP (individual nucleotide-resolution cross-linking immunoprecipitation) peaks for PanQk that did not overlap with control HA peaks is shown mapped to genome region (left) and motifs found from unique PanQk iCLIP peaks (right). (E) University of California at Santa Cruz (UCSC) Genome Browser screen shot showing Qk 3′ end with (from top to bottom) PanQk and HA iCLIP peaks; RefSeq genes; coverage tracks for siNT, siQk5-1, and siQk6/7; and conservation. (F) RT-qPCR analysis of RNA extracted from C2C12 myoblast cultures transfected with siNT, siQk5-1, or siQk6/7 for Qk5 (left) or Qk6/7 (right) RNA normalized to Gapdh RNA and displayed as fold change relative to siNT. Error bars show standard deviation from the mean using three independent biological replicates. (**) P < 0.01. (G) RT-qPCR analysis of nuclear RNA extracted from C2C12 myoblasts cultures transfected with siNT, siQk5-1, or siQk6/7 for Qk5 (left) or Qk6/7 (right) RNA normalized to 7SK RNA and displayed as fold change relative to siNT. Error bars show standard deviation from the mean using three independent biological replicates. (**) P < 0.01. (H) RT-qPCR analysis of samples described in G but measuring unspliced Qk5 or nonpolyadenylated Qk5 normalized to total Qk5 and displated as fold change relative to siNT. Error bars show standard deviation from the mean using three independent biological replicates. (**) P < 0.01 or P < 0.05.