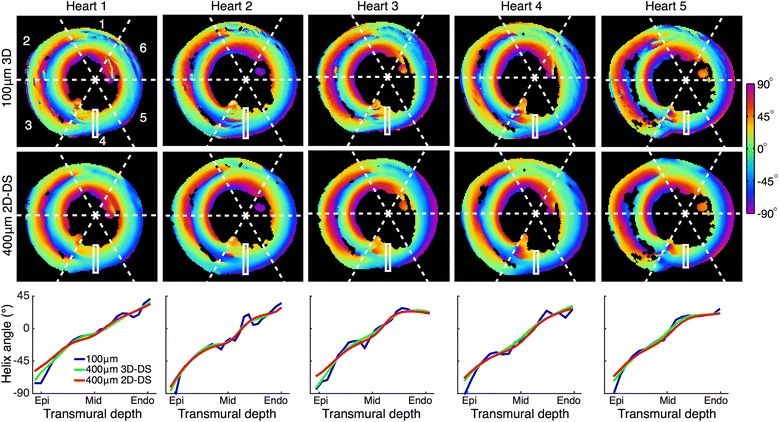
Fig. 2.

The effect of imaging resolution on transmural profiles in basal regions
Top row: Helix angles in American Heart Association regions 1–6, with the representative profile of region 4 indicated, reconstructed at 100 μm. Middle row: the same slice at with 400 μm in-plane resolution, 1200 μm slice thickness (interpolated to 100 μm resolution prior to model fitting). Bottom row: The transmural profile in region 4 at the three resolutions
