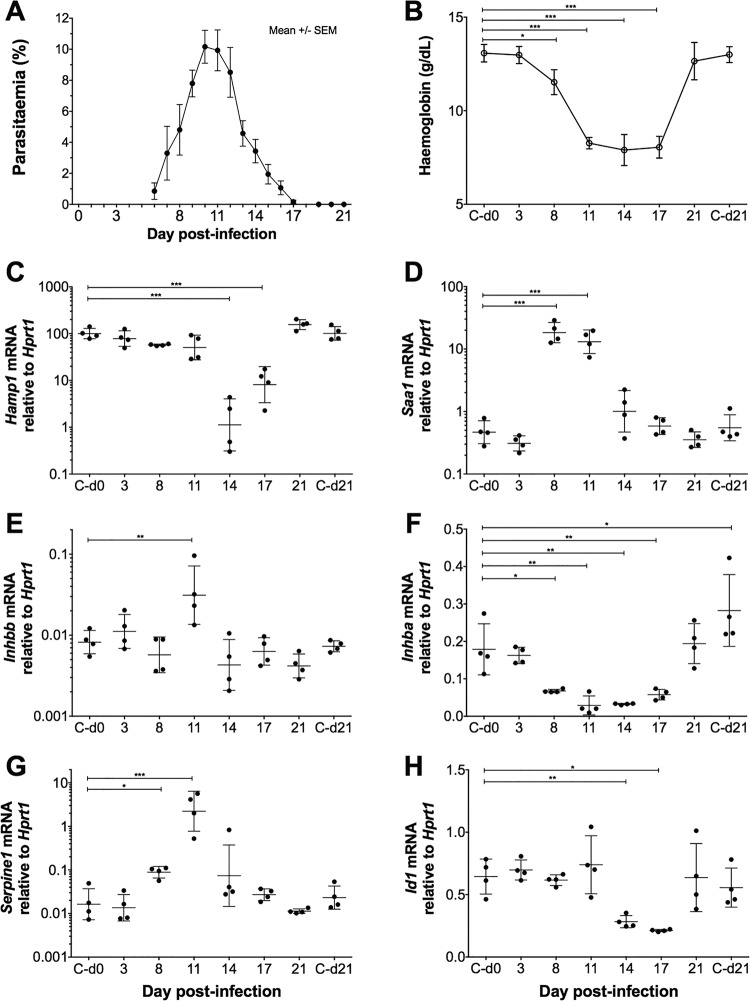
FIG 3.
Changes in activin gene expression during the course of Plasmodium chabaudi infection of C57BL/6 mice. Groups of mice infected with PccAS were culled at intervals following infection (n = 4/group). (A) Mouse parasitemia as percent infected red blood cells (means ± standard errors of the means [SEM]), monitored by thin smear (films were made from each mouse each day until they were culled, and data are plotted from day 6). (B) Hemoglobin concentrations during PccAS infection (data are missing from one mouse on day 11 due to sample clotting); C-d0 and C-d21 represent data from uninfected control mice culled on day 0 and day 21. (C to G) Hepatic gene expression analysis by qRT-PCR, plotting expression relative to the endogenous control gene, Hprt1, yielding the following results: no detectable increase in Hamp1 mRNA expression during parasitemia development but marked suppression during severe PccAS-associated anemia (C); upregulation of the acute-phase response gene Saa1 as parasitemia increases (D); increase in Inhbb mRNA expression on day 11 postinfection (E); downregulation of Inhba around peak parasitemia (F); upregulation of activin-responsive gene Serpine1 around peak parasitemia (G); BMP signaling indicator gene Id1 expression decreases at peak parasitemia (H). Statistical analyses were by one-way ANOVA with Dunnett's multiple-comparison test (relative to controls on day 0), and posttests were used. *, P < 0.05; **, P < 0.01; ***, P < 0.001. Plots depict means ± standard deviations, except where y axes are plotted on log scales, in which case statistical analyses are performed on log-transformed data and plots show geometric means ± geometric standard deviations.

