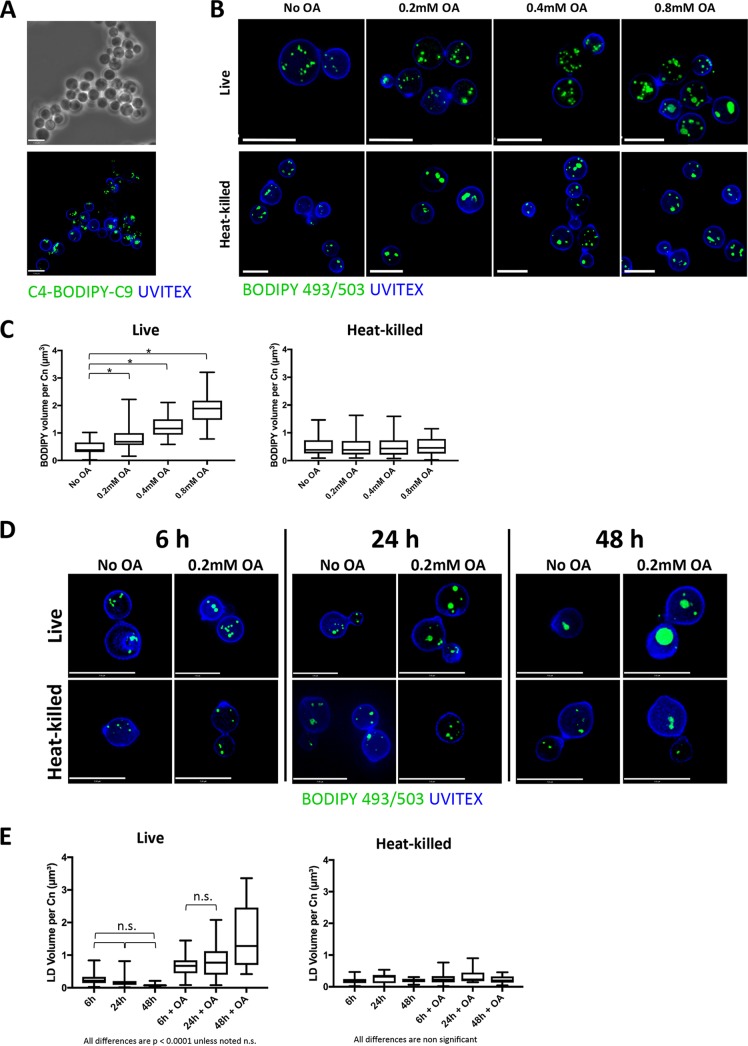
FIG 2.
Distribution of FA in extracellular C. neoformans. (A) Fluorescence microscopy of C. neoformans grown for 2 h in the presence of 10 mM C4-BODIPY-C9, fixed, and stained with Uvitex for the fungal cell wall. Scale bars, 7 μm. (B) Fluorescence microscopy of Uvitex-labeled live and HK C. neoformans incubated with 0.2 mM, 0.4 mM, or 0.8 mM OA or with no OA (control) for 2 h and stained with BODIPY 493/503 (LD). Scale bars, 7 μm. (C) Quantification of the LD volume in extracellular C. neoformans (Cn) when grown with excess OA. *, P < 0.0001 by one-way ANOVA and Tukey's multiple-comparison test. (D) Fluorescence microscopy of Uvitex-labeled live and heat-killed C. neoformans incubated with no OA or 0.2 mM OA for 6 h, 24 h, or 48 h and stained with BODIPY 493/503 (LD). Scale bars, 7 μm. (E) Quantification of the LD volume in extracellular C. neoformans when grown with 0.2 mM OA for 6 h, 24 h, and 48 h. Experiments were performed in triplicate, and all comparisons are significant at a P of <0.0001 by one-way ANOVA and Tukey's multiple-comparison test unless noted as nonsignificant (n.s.). In the graph of HK C. neoformans, there are no statistically significant differences by one-way ANOVA.

