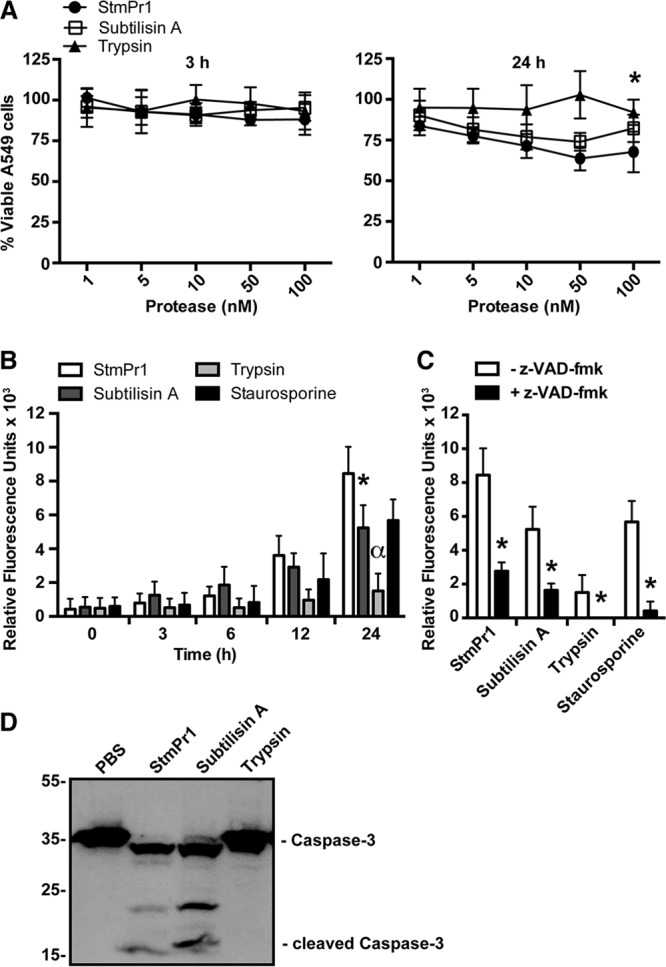
FIG 5.

Effect of purified StmPr1 compared to the effects of subtilisin A and trypsin on A549 cell viability. (A) A549 cells were incubated for 3 h and 24 h with the indicated equimolar concentrations of purified StmPr1, subtilisin A, or trypsin. Cell viability was measured using the metabolic dye PrestoBlue. Data were normalized to those for cells treated with PBS alone, the viability of which was set at 100%. *, statistically significant difference from the result for StmPr1 for both subtilisin A and trypsin (P < 0.001). (B) A549 cells were incubated with 100 nM purified StmPr1, subtilisin A, or trypsin for 24 h. Caspase-3/7 activity was monitored at the indicated times over the 24-h time course using CellEvent caspase-3/7 green detection reagent, where the background level of caspase activity for a PBS-treated control was subtracted from the values for the experimental samples. Staurosporine was included as a positive control for caspase activation. *, statistically significant difference from the result for StmPr1 (P < 0.001); α, statistically significant difference from the results for StmPr1, subtilisin A, and staurosporine (P < 0.001). (C) Caspase-3/7 activity was monitored as described in the legend to panel B after 24 h of incubation with 100 nM purified StmPr1, subtilisin A, or trypsin in the presence or absence of the pan-caspase inhibitor Z-VAD-FMK. *, statistically significant difference from the result obtained in the absence of Z-VAD-FMK (P < 0.001). (D) A549 cells were incubated with 100 nM purified StmPr1, subtilisin A, or trypsin for 24 h. Cell lysates were collected and analyzed by SDS-PAGE and immunoblot analysis with an anti-caspase-3 antibody. The sizes of caspase-3 and cleaved caspase-3 are indicated. The migration of molecular mass standards (in kilodaltons) is indicated to the left of the gel images. Data are representative of those from three independent experiments. Data are represented as the mean and SD from three independent experiments.
