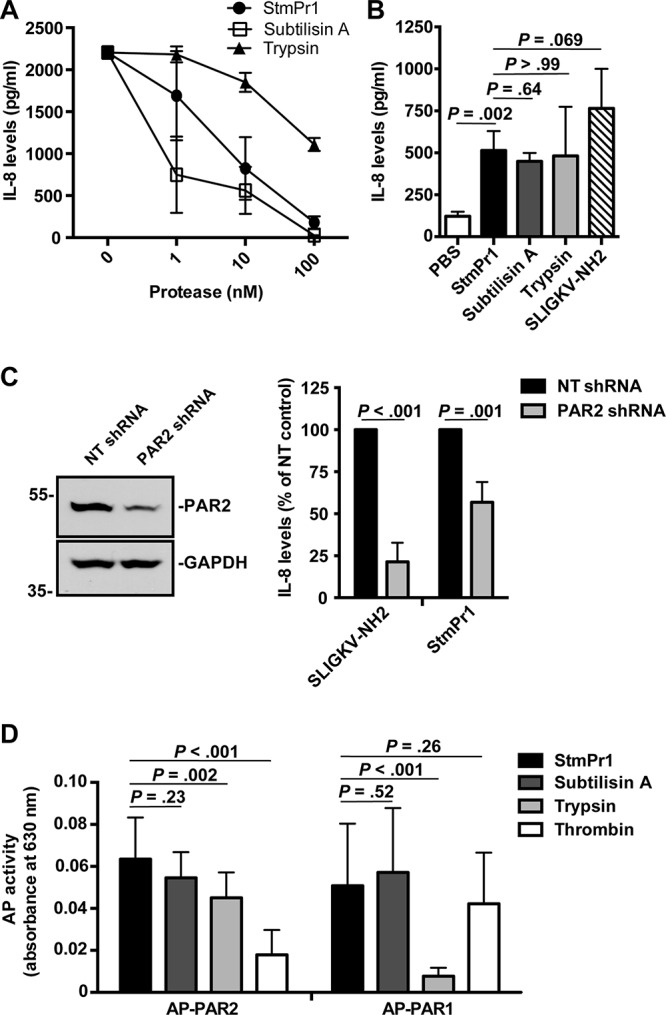
FIG 6.

Activation of PAR2 by StmPr1 compared to that by subtilisin A and trypsin. (A) Recombinant IL-8 was incubated at 37°C for 16 h with the indicated concentrations of StmPr1, subtilisin A, or trypsin, and IL-8 levels were quantified by ELISA. (B) A549 cells were incubated with 3 nM purified StmPr1, subtilisin A, or trypsin or 100 μM the PAR2 agonist SLIGKV-NH2 and a PBS-treated control for 16 h. IL-8 levels in the cell culture supernatants were quantified by ELISA. (C) A549 cells that were transfected with PAR2-targeting shRNA and nontargeting (NT) shRNA were incubated with 100 μM SLIGKV-NH2 and 3 nM purified StmPr1 for 16 h. (Right) IL-8 levels in the cell culture supernatants were quantified by ELISA and normalized to the levels for control cells transfected with the NT shRNA for each cell line, which were set at 100%. (Left) Knockdown of PAR2 was confirmed via immunoblot analysis with an anti-PAR2 antibody and an anti-GAPDH loading control. The sizes of molecular mass standards (in kilodaltons) are indicated to the left of the gel images. (D) CHO cells that were transfected with alkaline phosphatase (AP)-labeled PAR1 and PAR2 reporter constructs were incubated with 10 nM purified StmPr1, subtilisin A, trypsin, or thrombin for 1 h. AP levels in the cell culture supernatants were quantified by measuring AP activity, where AP activity in the cell culture supernatant indicates that cleavage of the AP reporter from the PAR N terminus has occurred. The background level of AP activity measured for a PBS-treated control was subtracted from the values for the experimental samples. Data are represented as the mean and SD from three independent experiments.
