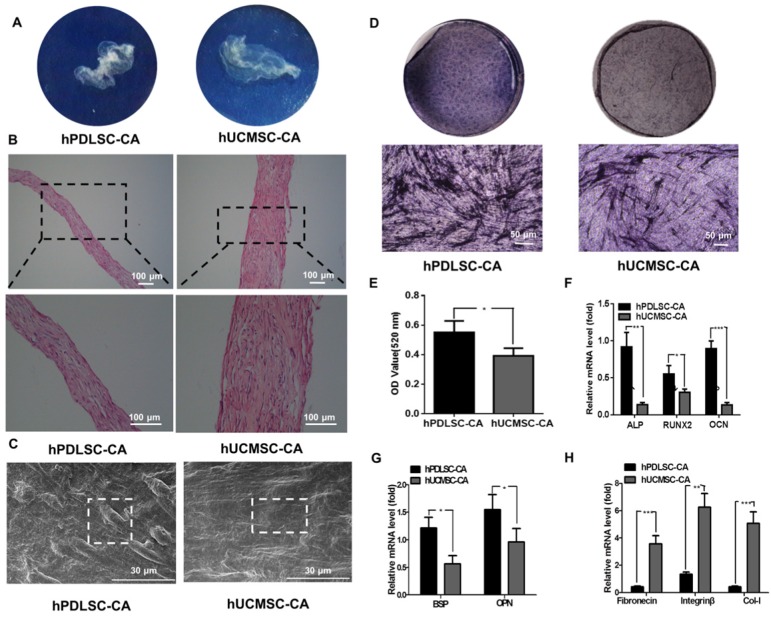
Figure 2.
Morphology of hPDLSCs-CA and hUCMSCs-CA. (A) Representative macroscopic images of hPDLSCs-CA and hUCMSCs-CA plated on culture dishes. (B) Representative hematoxylin and eosin (H&E) staining images of hPDLSCs-CA and hUCMSCs-CA. (C) Representative scanning electron microscopy (SEM) images of hPDLSCs-CA and hUCMSCs-CA. (D) Representative images of ALP staining in hPDLSCs-CA and hUCMSCs-CA after osteogenic induction for 7 days. (E) Quantitative analysis of ALP activity in hPDLSCs-CA and hUCMSCs-CA. RT-qPCR analysis of the expression of classical osteogenesis associated factors (F), markers of osteoblast and cementoblast phenotypes (G) and extracellular matrix (ECM) (H) between hPDLSCs-CA and hUCMSCs-CA at the gene level.

