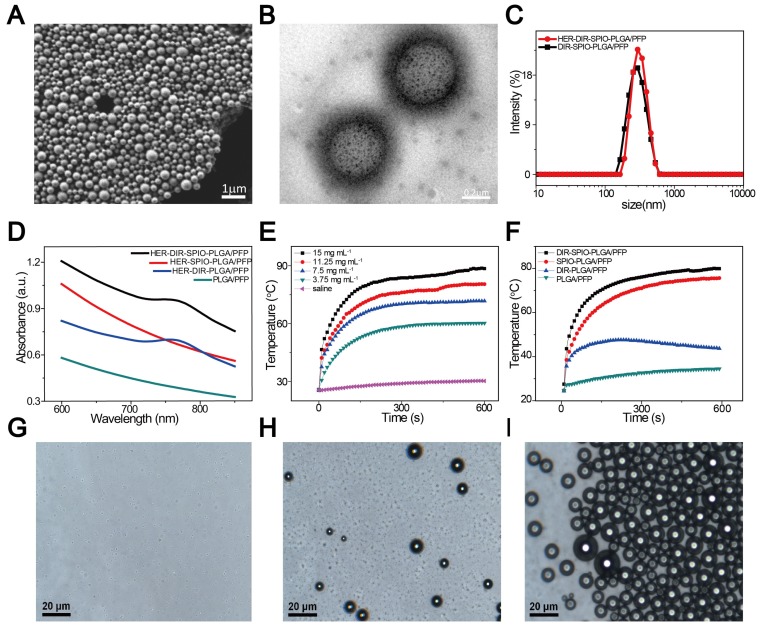
Figure 2.
Particle characterization. (A) A SEM image of the HER2 targeted nanoparticles. (B) The TEM image shows the location of the SPIO nanoparticles within the PLGA shell (black dots). (C) Size distribution of HER2 targeted (red) and untargeted (black) nanoparticles in aqueous solution measured by dynamic light scattering (DLS). (D) UV-vis spectra of the nanoparticles and their constituents. (E) Temperature elevation of different concentrations of DIR-SPIO-PLGA/PFP nanoparticles within 10 min irradiation time. (F) Photothermal curves of different nanoparticles irradiated at 2 W·cm-2 for 10 min. Optical microscopy images of the nanoparticles before (G), 20 s (H) and 1 min (I) after laser irradiation.

