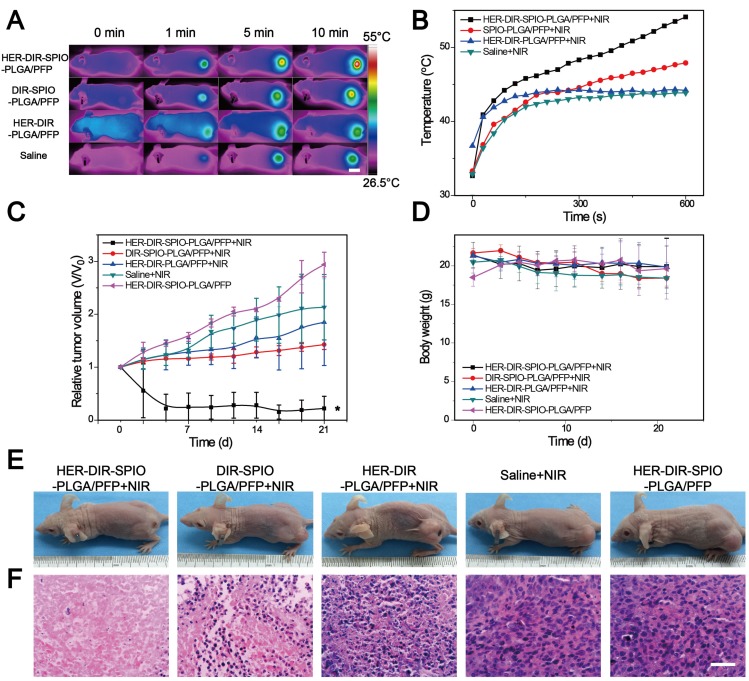
Figure 6.
In vivo thermal imaging, photothermal therapy. (A) IR thermal images of treatment groups and (B) temperature variation of tumor-bearing mice after intravenous injection of the HER2 targeted nanoparticles and controls and irradiation for 10 min using an 808 nm laser at 2 W·cm-2 (6 h post injection, mean ± SD, n = 3, scale bar = 1 cm ). (C) The relative tumor growth curves and (D) mice body weights during the various treatments over the 21 day study period (mean ± SD, n = 3, *P < 0.05). (E) Representative photos of mice bearing SKBR3 tumor with different treatments after 21 days. (F) Microscopy images of H&E stained tumor tissues in various groups (×400 magnification, scale bar = 100 µm).

