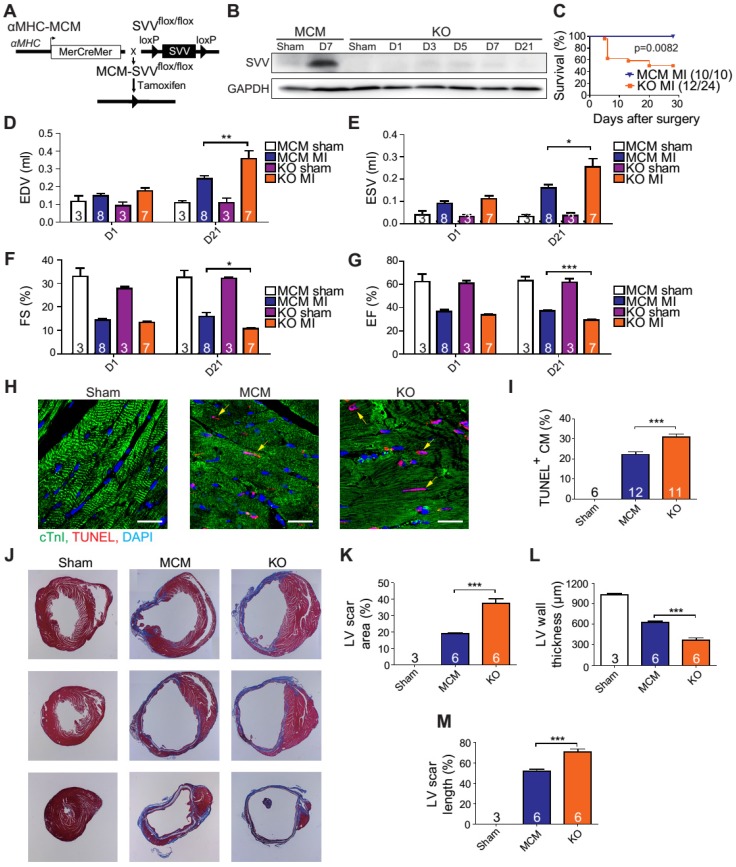
Figure 2.
Phenotype of SVV knockout (KO) mice after MI. A, Schematic diagram showing establishment of inducible, cardiac-specific SVV KO mouse. B, Western blot showing SVV KO efficiency after MI. C, Survival curve of MCM and KO mice over 28 days following MI surgery. D-G, Cardiac function of MCM and KO mice 1 day and 21 days after MI. EDV, end diastolic volume; ESV, end systolic volume; FS, fraction shortening; EF, ejection fraction.*, P<0.05; **, P<0.01; ***, P<0.005. H, TUNEL staining indicating apoptotic cardiomyocytes, marked with yellow arrows. White bar, 20 μm. I, Quantification of TUNEL positive cardiomyocyte (CM) at the border zone. ***, P<0.005. J, Trichrome staining of hearts 30 days after receiving MI surgery. K-M, Quantification of left ventricle (LV) scar area percentage, LV wall thickness, and scar length percentage of heart after MI. *** P<0.005.

