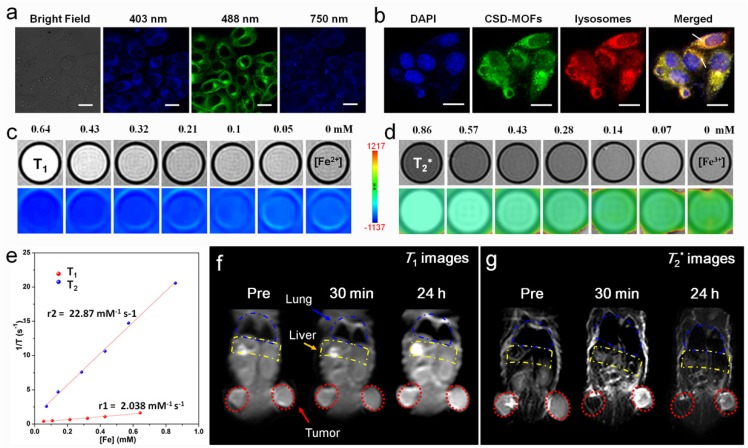
Figure 6.
(a) CLSM images of HeLa cells under 403 nm, 488 nm single-photon and 750 nm two-photon excitation after incubation with CSD-MOFs. (b) CLSM image of HeLa cells stained with DAPI, mCherry-LAMP-1 and incubated with CSD-MOFs. (c) In vitro T1- and (d) T2*-weighted MR images of CSD-MOFs. (e) T1 and T2* relaxation rates as a function of Fe concentration of CSD-MOFs nanoparticles. (f) In vivo T1- and (g) T2*-weighted MR images of HeLa tumor-bearing BALB/c mouse before, 30 min, and 24 h after intravenous injection of CSD-MOFs. (All scale bars: 20 μm).

