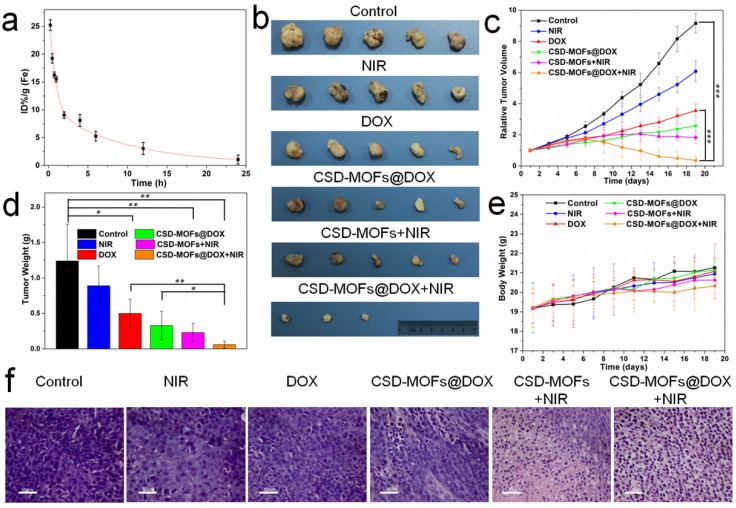
Figure 8.
(a) Blood circulation of CSD-MOFs and the pharmacokinetics followed the two-compartment model. (b) Photographs of tumors harvested from mice receiving different therapeutic treatments. (c) Tumor growth curves of the corresponding group. (d) The tumors collected from all groups were weighted 19 days after various treatments. (e) Body weights of mice for varied time periods for 19 days. (f) Slices of tumor tissues stained with hematoxylin and eosin. (All the scale bar: 50 μm) Statistical analysis was performed using the Student's two-tailed t-test (*p <0.05, **p <0.01 and ***p <0.001).

