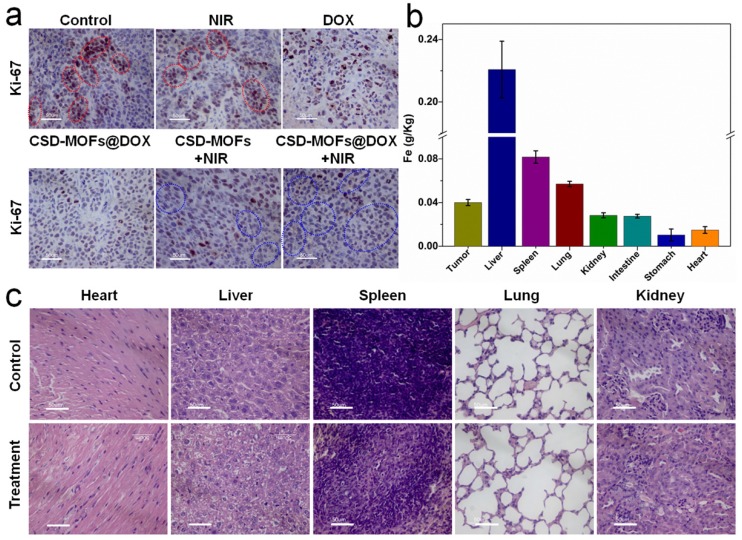
Figure 9.
(a) Ki-67 stain of tumor sections collected from differently treated groups of mice. The brown nucleus (see those cells in red circles) indicated the proliferation of cells and the light blue nucleus (blue circles) indicated the inhibited proliferation of cells. (b) Biodistribution of Fe in the major organs of the HeLa tumor-bearing mice at 24 h post intravenous injection of CSD-MOFs. (c) H&E stained images of major organs of mice at 19th day. (All the scale bar: 50 μm).

