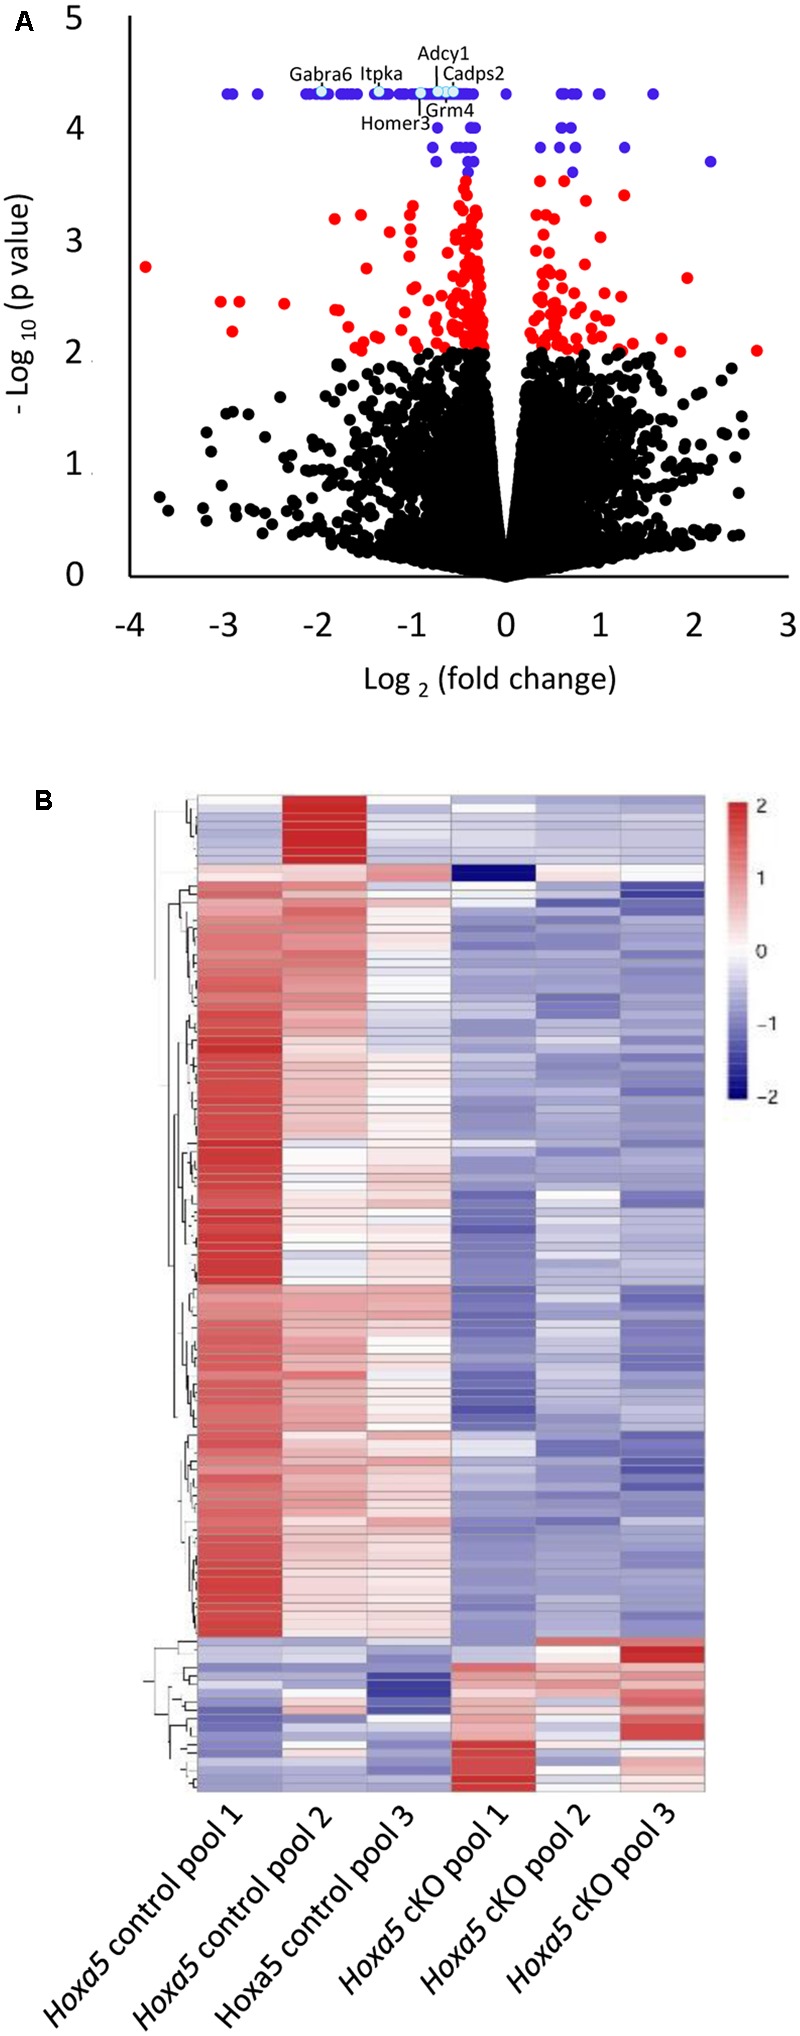
FIGURE 1.

Transcriptome analysis of P21 brainstem in tamoxifen-treated Hoxa5flox/flox;CMV-CreERT2-/- (Hoxa5 control) and tamoxifen-treated Hoxa5flox/flox;CMV-CreERT2+/- (Hoxa5 cKO) (n = 3 pools of 3 individuals per genotype). (A) Volcano plot (p-value versus fold change) of differentially expressed transcripts. Transcripts whose abundance level is significantly modified in Hoxa5 cKO (q-value <0.05) are colored in blue, while those with a q-value >0.05 and a p-value <0.01 are colored in red. (B) Heatmap showing hierarchical clustering of significantly downregulated (blue) and upregulated (red) transcripts (q-value <0.05) in the Hoxa5 control pools and in the Hoxa5 cKO pools. A large proportion of significantly downregulated transcripts are detected in the Hoxa5 cKO pools. See Supplementary Table S3 for complete list of genes.
