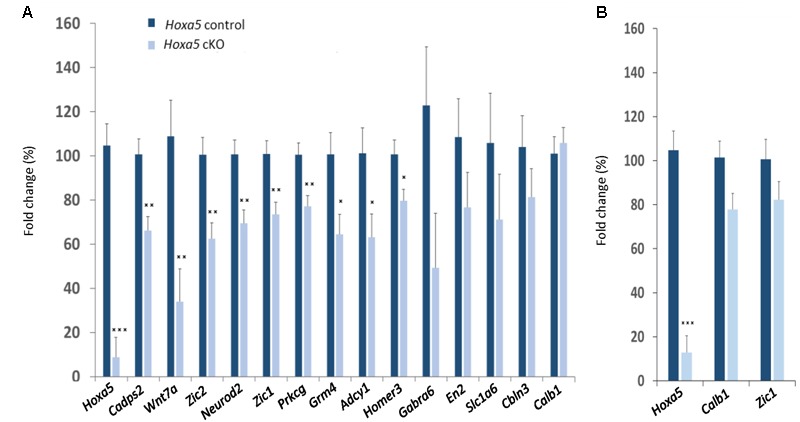
FIGURE 3.

RT-qPCR analysis of selected candidate target genes of HOXA5 in the medulla oblongata (A) and pons (B) of tamoxifen-treated Hoxa5flox/flox;CMV-CreERT2-/- (Hoxa5 control; dark blue) and tamoxifen-treated Hoxa5flox/flox;CMV-CreERT2+/- (Hoxa5 cKO; light blue) at P21. Data are reported as means ± SEM. Asterisks depict statistically significant differences compared with Hoxa5 control brains: ∗∗∗p < 0.001, ∗∗p < 0.01, and ∗p < 0.05. p-Values are from ANOVA test and are provided in Table 1. n = 3–6 for Hoxa5 control brains, n = 3–8 for Hoxa5 cKO brains. The relative transcripts abundance is calculated using the 2-ΔΔCt method as detailed in Section “Materials and Methods,” where normalized values measured in Hoxa5 cKO are reported to normalized values measured in Hoxa5 control. The fold change is presented as a percentage of this value: (2-ΔΔCt) × 100.
