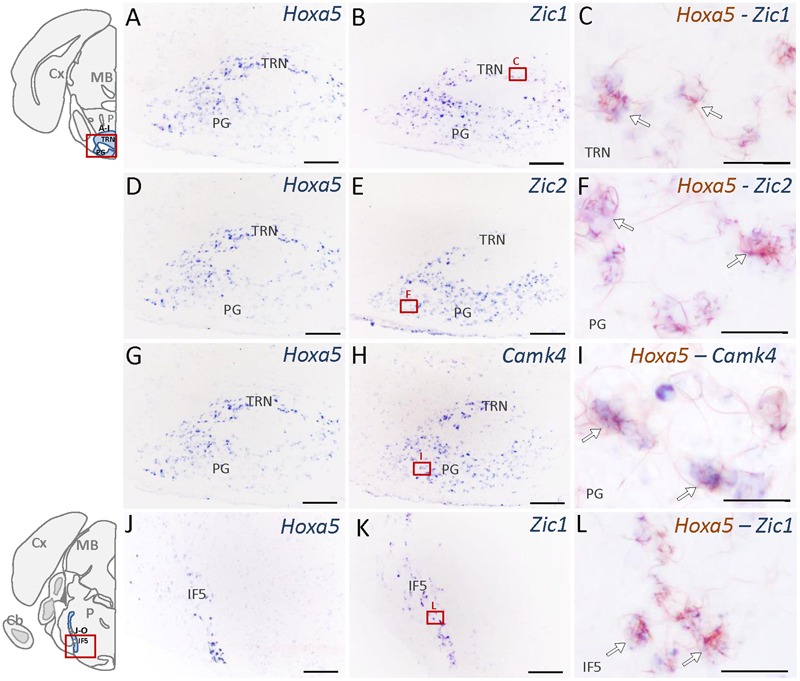
FIGURE 4.

Expression of HOXA5 candidate target genes in the pons analyzed by single and double in situ hybridization (ISH) on coronal cryosections of P21 mouse brains. Schematic views of coronal brain sections illustrate brain structures while square red boxes on the schemes refer to the localization of single ISH pictures. In double ISH (right column) Hoxa5 signal is in red/brown precipitate while target gene signal is in blue. Localization of double ISH pictures is illustrated by square red boxes on the single ISH pictures (middle column). (A–C) Signal of Hoxa5 and Zic1 in the pontine gray (PG) and tegmental reticular nucleus (TRN). (D–F) Signal of Hoxa5 and Zic2 in PG and TRN. (G–I) Signal of Hoxa5 and Camk4 in PG and TRN. (J–L) Signal of Hoxa5 and Zic1 in the interfascicular trigeminal nucleus (IF5). As illustrated in the right column, many Hoxa5-positive cells also show labeling for target gene transcripts (white arrows). n = 2–4 brains hybridized for Hoxa5 and each target genes in single and double ISH. Cb, cerebellum; Cx, cortex; MB, mid brain; P, pons. Medial is on the right, lateral is on the left. Scale bar 200 μm in (A,B,D,E,G,H,J,K); 100 μm in (C,F,I,L).
