Abstract
Aim
The aim of this study was to evaluate the haemodynamic correlates of heart sound (HS) parameters such as third HS (S3), first HS (S1), and HS‐based systolic time intervals (HSTIs) from an implantable cardiac device.
Methods and results
Two unique animal models (10 swine with myocardial ischaemia and 11 canines with pulmonary oedema) were used to evaluate haemodynamic correlates of S1, S3, and HSTIs, namely, HS‐based pre‐ejection period (HSPEP), HS‐based ejection time (HSET), and the ratio HSPEP/HSET during acute haemodynamic perturbations. The HS was measured using implanted cardiac resynchronization therapy defibrillator devices simultaneously with haemodynamic references such as left atrial (LA) pressure and left ventricular (LV) pressure. In the ischaemia model, S1 amplitude (r = 0.76 ± 0.038; P = 0.002), HSPEP (r = −0.56 ± 0.07; P = 0.002), and HSPEP/HSET (r = −0.42 ± 0.1; P = 0.002) were significantly correlated with LV dP/dtmax. In contrast, HSET was poorly correlated with LV dP/dtmax (r = 0.14 ± 0.14; P = 0.23). In the oedema model, a physiological delayed response was observed in S3 amplitude after acute haemodynamic perturbations. After adjusting for the delay, S3 amplitude significantly correlated with LA pressure in individual animals (r = 0.71 ± 0.07; max: 0.92; min: 0.17) as well as in aggregate (r = 0.62; P < 0.001). The S3 amplitude was able to detect elevated LA pressure, defined as >25 mmHg, with a sensitivity = 58% and specificity = 90%.
Conclusions
The HS parameters such as S1, S3, and HSTIs measured using implantable devices significantly correlated with haemodynamic changes in acute animal models, suggesting potential utility for remote heart failure patient monitoring.
Keywords: Heart sound, Systolic time interval, Heart failure, Contractility, Pulmonary congestion
Introduction
The pathophysiology of heart failure (HF) decompensation is characterized by the degree of congestion (dry/wet) and state of perfusion (cold/warm).1 Implantable device‐based diagnostic parameters coupled with remote patient monitoring infrastructure have the potential to enable monitoring of clinical changes in HF status early enough to prevent hospitalization without the need for a regular and frequent in‐clinic interaction.2, 3
Implantable pressure sensors have been developed to monitor elevated filling pressures associated with HF.4 However, pressure sensor monitoring requires implanting a dedicated device via an invasive procedure, which exposes patients to added risks. The third heart sound (S3), which is caused by rapid deceleration of the blood against a stiff ventricle during early diastolic filling, is regarded as one of the earliest signs of HF.5, 6 The S3 is also known to be moderately sensitive but highly specific to elevated left ventricular (LV) filling pressures7, 8 and predictive of 1‐year mortality.9 An implanted device‐based S3 sensor can serve as a useful surrogate for intracardiac haemodynamics10 without requiring an additional procedure to implant a dedicated intravascular device.
Volume status (as assessed by intrathoracic impedance or weight) and filling pressures (as assessed by S3 or pressure sensors) track worsening along the congestion axis but not along the perfusion axis, which may represent 24% of HF hospitalizations.1 First heart sound (S1) and systolic time intervals (STIs), such as pre‐ejection period and left ventricular ejection time, which are known to be related to myocardial contractility,11, 12, 13 may be useful candidates to monitor patients along this axis because a downstream effect of reduced contractility is diminished forward perfusion. Traditionally, true STIs have been measured by aligning phonocardiographic heart sounds (HSs) with arterial pressure tracing from the carotid pulse.14 However, the relationship of HS signals measured from an implanted cardiac device, for example, time intervals (HSTIs) based exclusively on the S1 and S2 timings and S1 amplitude, with myocardial contractility is not known.
The aim of this study was to evaluate the haemodynamic correlates of HS parameters from an implantable cardiac device in two unique animal models.
Methods
Two unique animal models were used to evaluate the impact of worsening cardiac function on HS, namely, an acute ischaemia induction to model the contractility changes in HF and an acute pulmonary oedema induction to model congestion in HF. The two models were implemented separately in distinct sets of animals. All animals were acutely implanted with three transvenous leads and a cardiac resynchronization therapy defibrillator (CRT‐D) device (COGNIS®, Boston Scientific, Marlborough, MA) modified via a software download to enable recording and storing HS data from the embedded accelerometer. Both studies were approved by the Boston Scientific Corporation Institutional Animal Care and Use Committee and carried out at an American Association for the Accreditation of Laboratory Animal Care facility in compliance with regulations set forth in the Animal Welfare Act, Title 9, CFR, Chapter 1, Subchapter A and principles outlined in the ‘Guide for the Care and Use of Animals’, by National Research Council.
Study protocol
Ischaemia model
Acute myocardial ischaemia was created using a coronary artery balloon occlusion protocol in 10 swine. The animals were sedated with tiletamine, zolazepam, ketamine, xylazine (TKX), induced with 5% propofol, intubated, and placed on a volume‐controlled ventilator. Oxygen and isoflurane gas were used to maintain a surgical plane of anaesthesia. An epidural of morphine and bupivacaine was administered for analgesia. Surgical access sites were created at the jugular, carotid, and/or femoral vascular beds. The animals were also given heparin and anti‐arrhythmic drugs amiodarone, lidocaine, and/or procainamide as needed on an individual basis.
The LV pressures were measured using pressure microtip catheters (Millar Instruments Inc., Houston, TX) placed in the LV chamber. After baseline data collection, the left coronary artery was cannulated and an angiogram performed to visualize the coronary tree to determine best placement of the occlusion. An angioplasty balloon of appropriate size and length was then positioned and inflated to occlude the vessel for up to 60 min. The occlusion was performed in the left anterior descending artery in five animals and left circumflex artery in five animals.
Following the in vivo procedure, necropsy was performed to quantify the ischaemic area at risk of the left ventricle expressed as a percent of the LV mass in 9/10 animals (one animal excluded because of staining failure).
Oedema model
Pulmonary oedema was induced via an increase in both preload and afterload in 11 canines. An increase in intravascular volume was performed by excessive administration of colloid, and excessive afterload resulted from resistance to flow by inflation of a balloon in the descending aorta, along with concomitant administration of an alpha‐1 adrenergic agonist, phenylephrine. The animal was sedated with intramuscular butorphanol, induced with propofol, and placed on a volume‐controlled ventilator with isoflurane gas anaesthesia. A pressure microtip catheter (Millar Instruments Inc.) was inserted through the right carotid artery and advanced into the left atrium. A NuMed balloon was inserted via the right femoral artery and advanced into the descending arch of the aorta. Cannulations in the right jugular vein and left carotid artery were used for the injection port and the thermistor readouts of the PiCCO system (Pulsion Medical Systems SE, Munich, Germany), respectively, that monitored extravascular lung water (EVLW) and arterial pressure upstream of the balloon.
Preload was enhanced by infusing the animal with up to 3 L of 6% hetastarch colloid prior to inflating the balloon concurrently with canine packed red blood cells to avoid hemodilution. NuMed balloon was then inflated to 10 mL, and its location in the descending arch was confirmed via fluoroscopy. The onset of balloon inflation resulted in an instantaneous sharp rise in filling pressures (left atrial pressure, LAP), presumably due to obstruction of outward flow, which then declined gradually over the next few minutes as a result of compensatory autonomic response. Intravenous phenylepherine was then initiated to increase LAP. In these animals, the desired elevation in LAP post‐balloon inflation was achieved with minimal concurrent crystalloid fluid infusion (150–200 mL/h). At the end of the experiments, the lungs were excised post‐mortem, and pulmonary oedema was confirmed via gravimetric analysis.
Measurements
Haemodynamics
In the ischaemia protocol, LV pressure was used to calculate the maximum pressure slope (dP/dtmax) for each cardiac cycle as an indicator of the LV contractility and averaged every 2 min intervals (Figure 1). Baseline reference measurements were obtained in the 5 min preceding occlusion.
Figure 1.
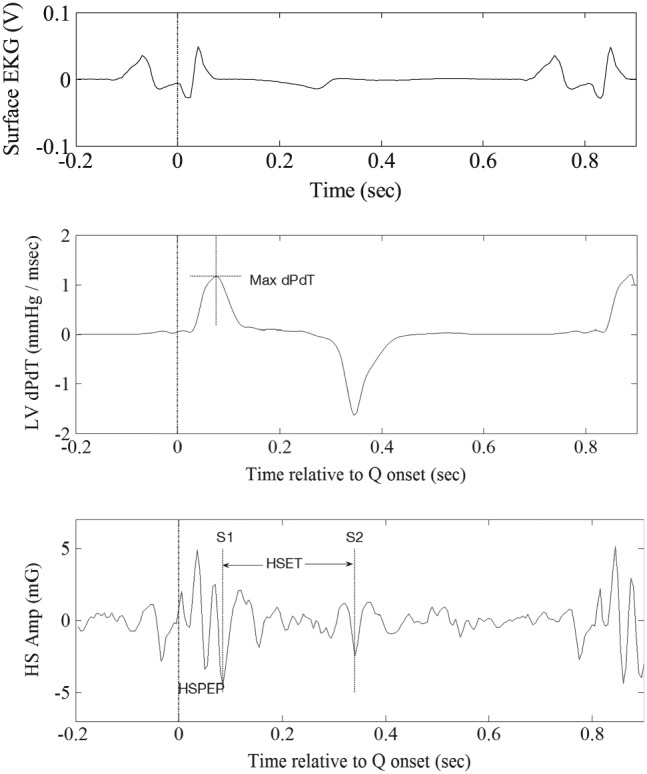
Measurement of maximum left ventricular (LV) pressure slope and the two heart sound (HS)‐based systolic time intervals, namely, HS‐based pre‐ejection period and HS‐based ejection time.
In the oedema protocol, the LAP signal was used to calculate the mean pressure for each cardiac cycle. In order to eliminate abrupt changes in LAP because of phenylephrine and because of slower time course of oedema built up as compared with ischaemia induction, 10 min averages were calculated. The EVLW was calculated approximately every 15 min through thermodilution using the PiCCO system.
Heart sounds
The implanted CRT‐D device was used to measure HS using its embedded accelerometer for both study protocols. Measurements were made on HS waveforms using previously described methods.15 Specifically, the raw HS waveforms were parsed into individual beats using device electrograms and averaged to obtained ensemble averages. Ensemble averaging helps mitigate the impact of non‐cardiac variability on the HS data such as due to respiration or other spurious external noise. After detecting the timings of S1 and S2 within the cardiac cycle, HS‐based pre‐ejection period (HSPEP) was defined as the time from the Q‐onset on the shock channel electrogram to the S1, whereas HS‐based ejection time (HSET) was defined as the time from S1 to S2 (Figure 1). The S1 and S3 amplitudes were measured as root mean square of appropriate segments encompassing the respective features. All measurements were appropriately synchronized and averaged for statistical comparisons with the reference haemodynamic parameters. For aggregate analysis across subjects, individual S3 measurements were normalized by the average root mean square of systolic portion of all HS waveforms from the particular subject.
Statistical analysis
The HS measurements were compared with the haemodynamic parameters using Pearson's linear correlation coefficient. Statistical significance (P using Wilcoxon signed‐rank test) is also indicated for each correlation coefficient value observed. Aggregate results are presented as mean ± SEM.
When comparing S3 amplitude with LAP in the oedema model, we observed instantaneous rises in LAP when the balloon was inflated while there were physiologically delayed responses in the HSs measurements in some of the animals. Peak cross‐correlation between two signals with up to 60 min delay was considered to account for physiologically delayed response in S3.
Results
Animal model efficacy
In the ischaemia model, arterial occlusion led to a sharp drop in contractility (LV dP/dtmax), from a pre‐occlusion baseline average of 981.3 ± 51.1 mmHg/s, which reached a minimum of 606.3 ± 70.8 mmHg/s in 21 ± 3.35 min post‐occlusion, yielding a total drop in contractility of 375 ± 56.5 mmHg/s. At necropsy, ischaemic area at risk was observed to be 17.5 ± 4.94% in four animals with left anterior descending occlusion and 30.0 ± 4.67% in five animals with left circumflex artery occlusion.
In the oedema model, balloon inflation led to an instantaneous jump in LAP (ΔLAP = 5.7 ± 0.73 mmHg) followed by a gradual decrease because of autonomic response (ΔLAP = −1.2 ± 0.24 mmHg). Subsequently, phenylepherine was introduced to build up the LAP pressure. The average increase in LAP compared with the pre‐balloon baseline was 19.1 ± 2.54 mmHg. The maximum LAP achieved across the animals was 36.8 ± 1.93 mmHg, and it took an average of 0.65 ± 0.10 h from the onset of balloon inflation to reach the maximum LAP. The wet‐to‐dry ratio achieved across animals ranged from 5.57 to 14.88 (average: 9.75 ± 1.00), indicating that pulmonary oedema was achieved in all 11 animals.
Correlation of heart sounds with haemodynamics
Ischaemia model
The drop in contractility following the arterial occlusion was accompanied by a concurrent decrease in S1 amplitude (ΔS1 = 2.6 ± 0.46 mG) and an increase in HSPEP (ΔHSPEP = 7.87 ± 2.71 ms). The temporal profiles of S1 amplitude and HSPEP follow the temporal patterns in LV dP/dtmax remarkably well in the example animal shown in Figure 2 A and were significantly correlated (Figure 2 B: LV dP/dtmax vs. S1 amp: r = 0.91; P < 0.0001; LV dP/dtmax vs. HSPEP: r = −0.78; P < 0.0001). The relationship was consistent and significant across all the animals studied (Table 1: LV dP/dtmax vs. S1 amp: r = 0.76 ± 0.038; P = 0.002; LV dP/dtmax vs. HSPEP: r = −0.56 ± 0.07; P = 0.002; Wilcoxon sign rank test). Furthermore, the ratio HSPEP/HSET was also significantly correlated to LV dP/dtmax within this animal (r = −0.65; P < 0.0001) as well as across all animals (r = −0.42 ± 0.1; P = 0.002; Wilcoxon sign rank test). In contrast, HSET was poorly correlated with LV dP/dtmax, both within this animal (r = 0.05; P = 0.78) and across animals (r = 0.14 ± 0.14; P = 0.23; Wilcoxon sign rank test), which is consistent with prior reports of poor relationship between left ventricular ejection time and LV dP/dtmax. 13
Figure 2.
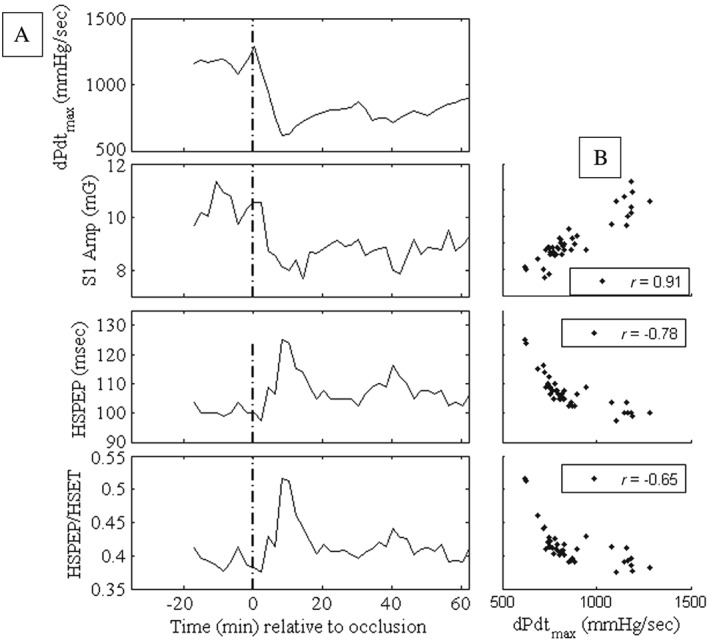
Temporal evolution of haemodynamics and heart sound parameters (A) and the corresponding scatter plots (B) in an animal during the ischaemia protocol. HSET, heart sound‐based ejection time; HSPEP, heart sound‐based pre‐ejection period; S1, first heart sound.
Table 1.
Haemodynamic correlations in ischaemia model (left columns) and pulmonary oedema model (right columns)
| Ischaemia model | Pulmonary oedema model | ||||||
|---|---|---|---|---|---|---|---|
| Animal (swine) | LV dP/dtmax vs. S1 amplitude | LV dP/dtmax vs. HSPEP | LV dP/dtmax vs. HSPEP/HSET | LV dP/dtmax vs. HSET | Animal (canines) | LAP vs. S3 Amplitude | Delays (min) |
| 1 | 0.89 | −0.22 | −0.26 | 0.19 | 1 | 0.17 | 60 |
| 2 | 0.91 | −0.78 | −0.65 | 0.05 | 2 | 0.79 | 20 |
| 3 | 0.72 | −0.54 | −0.38 | 0.19 | 3 | 0.76 | 0 |
| 4 | 0.93 | −0.37 | −0.01 | −0.51 | 4 | 0.65 | 10 |
| 5 | 0.71 | −0.96 | −0.96 | 0.90 | 5 | 0.59 | 10 |
| 6 | 0.60 | −0.57 | −0.40 | 0.10 | 6 | 0.53 | 10 |
| 7 | 0.75 | −0.77 | −0.78 | 0.64 | 7 | 0.68 | 0 |
| 8 | 0.59 | −0.35 | −0.21 | 0.03 | 8 | 0.91 | 60 |
| 9 | 0.81 | −0.43 | −0.02 | −0.47 | 9 | 0.91 | 10 |
| 10 | 0.72 | −0.63 | −0.57 | 0.31 | 10 | 0.92 | 10 |
| 11 | 0.90 | 50 | |||||
| Average | 0.76 | −0.56 | −0.42 | 0.14 | Average | 0.71 | 22 |
Oedema model
On average, LAP increased from a baseline of 15.6 mmHg to a peak of 35.3 mmHg after occlusion, and correspondingly, S3 increased from 0.55 to 1.12 mG. Figure 3 B illustrates a typical example of HS waveforms before and after the inflation of balloon. The S3 portion of the waveform was notably amplified after occlusion because of the increase in LAP. In the example animal of Figure 3 A, infusion of 6% hetastarch was completed by 1:00 p.m. resulted in an increase in mean LAP to 24 mmHg, which then dissipated to 17 mmHg just prior to balloon inflation at 1:50 p.m. A shift in afterload due to balloon inflation caused an instantaneous increase in LAP to 26 mmHg. Phenylepherine was started at 2:00 p.m. at a dose of 1 mcg/kg/min and titrated up to 5 mcg/kg/min over the next 2 h, causing LAP to build up to levels substantially higher than 25 mmHg, the transudation threshold for pulmonary oedema,16 and reaching a maximum of 32 mmHg at 3:05 p.m. The build‐up of oedema is reflected in the gradual increase in EVLW from 320 mL just prior to balloon inflation to 443 mL at peak LAP and a concurrent rise in S3 amplitude.
Figure 3.
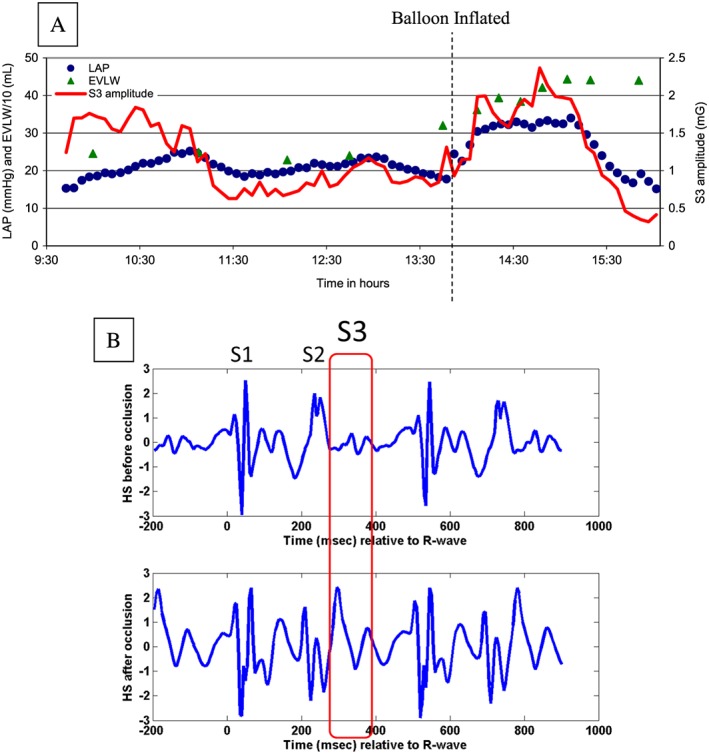
Temporal evolution of parameters during the oedema protocol (A) and example heart sound waveform before and after the balloon occlusion (B). EVLW, extravascular lung water; HS, heart sound; LAP, left atrial pressure; S1, first HS; S2, second HS; S3, third HS.
Interestingly, S3 response following the LAP rise was delayed by 22 ± 7 min (range: 0–60 min) across the 11 animals (one case shown in Figure 4). After accounting for this delay, S3 amplitudes significantly correlated with LAP in individual animals (Table 1: r = 0.71 ± 0.07; max: 0.92; min: 0.17) as well as in aggregate (r = 0.62; P < 0.001; Figure 5 A). Detection of elevated LAP defined as LAP >25 mmHg with S3 was achieved with sensitivity = 58%, specificity = 90%, and area under the curve (AUC) = 0.81 (Figure 5 B). The moderately sensitive and highly specific performance was consistent at detecting modest changes in LAP as well (LAP > 15 mmHg: sensitivity = 79%, specificity = 83%, AUC = 0.85; LAP > 20 mmHg: sensitivity = 60%, specificity = 88%, AUC = 0.81).
Figure 4.
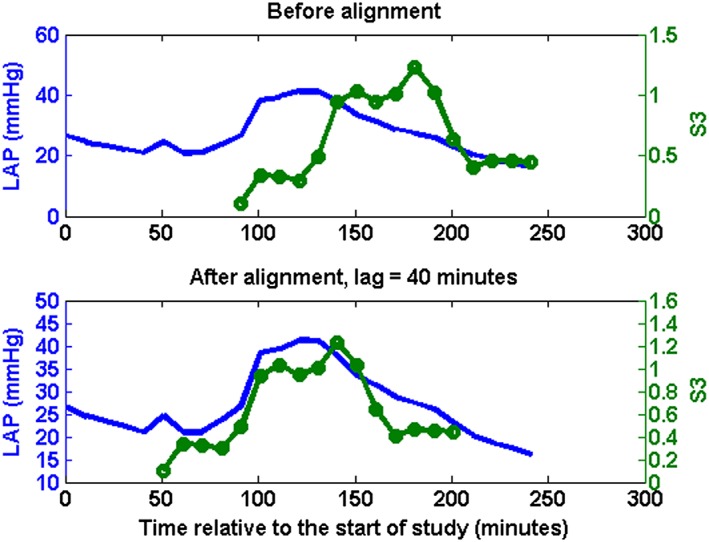
Left atrial pressure (LAP: solid blue without circles) and third heart sound (S3: solid green line with circles) measurements from one animal before and after adjusting for physiological delays.
Figure 5.
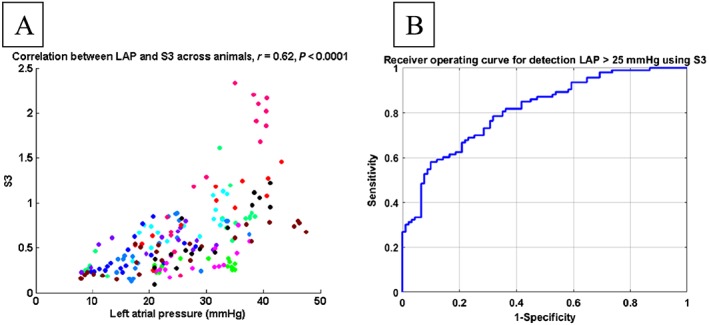
Correlation between third heart sound (S3) and left atrial pressure (LAP) (each colour represents data from one animal) after adjusting for physiological delay (A) and receiver operating curve for detecting elevated LAP using S3 (B).
The animal with the weakest correlation between S3 amplitude and LAP had unusually elevated baseline S3 amplitude before the inflation that dropped substantially at the time of inflating the balloon (Figure 6). However, following the balloon inflation, S3 amplitude did reflect the changes in LAP with a moderate correlation of 0.65 (compared with 0.17 over entire data) if the comparison is limited to the shaded region (Figure 6).
Figure 6.
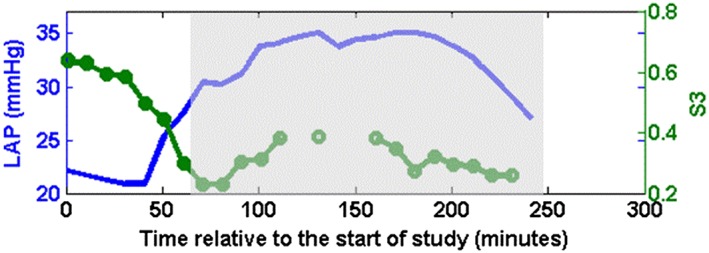
Left atrial pressure (LAP: Solid blue line without circles) and third heart sound (S3: Solid green line with circles) from one animal that had the worst correlation.
Discussion
In this study, we evaluated the haemodynamic correlates of Heart Sound measured using an embedded accelerometer within a CRT‐D device implanted in the pectoral region via two animal models. The first model, which involved ischaemia induction via coronary artery occlusion, was intended to mimic the reduced contractility seen in HF due to systolic dysfunction. The change in LV dP/dtmax was significantly correlated to accelerometer‐based S1 amplitude and inversely correlated to accelerometer‐based timing intervals such as HSPEP and HSPEP/HSET, consistent with prior studies that have evaluated these relationships using conventional methods of measuring HS and STIs.13
The second animal model, which involved induction of pulmonary oedema, mimics the congestive aspect of HF characterized by elevated filling pressure and frank oedema. The change in LAP was significantly correlated with S3 amplitude. Furthermore, the performance of detecting elevated LAP using accelerometer‐based S3 was consistent with a prior study showing high specificity of phonocardiographic S3 to elevated filling pressures.7
An interesting finding was the temporal delay in S3 response relative to rising LAP. While the S3 amplitudes were found to be significantly correlated with LAP in individual animals after accounting for these delays, the mechanism for this delay is not completely understood. One possibility is that as the hearts in this model were from healthy canines, the change in myocardial compliance in response to elevated pressure is not as immediate as might be expected in animals with dilated hearts.
Third heart sound, elevated filling pressure, and heart failure
Decompensated HF is characterized by elevated filling pressures that lead to pulmonary congestion and frank oedema. The LAP, which can provide a direct assessment of elevated filling pressures, is challenging to measure directly as it involves an invasive transeptal procedure.17 Indirect measures of left‐sided filling pressures using a wireless pulmonary artery pressure monitor (CardioMEMS™) have been shown to correlate with Swan–Ganz derived pulmonary artery pressures,18 and in the CHAMPION study, reaction to pulmonary artery pressure data saw a 30% reduction in HF hospitalization at 6 months.4 Although they have recently received a class IIb (B) recommendation in the European Society of Cardiology guidelines,19 these devices require an additional implant, and due to the high upfront cost, cost‐effectiveness data are required in non‐US countries to allow the more widespread acceptance of this technology.
Phonocardiographic S3 has been shown to be a highly specific but moderately sensitive sign of elevated filling pressures.7 The S3 is believed to originate from mechanical vibrations of the cardiohemic structure20, 21, 22 (ventricular wall, intraventricular blood pool, and surrounding structures) due to rapid deceleration of blood during early diastolic filling.5 Presence of S3 is associated with steeper pressure rise during rapid filling wave portion of LV pressure tracing20, 23 as well as increased LV chamber stiffness.10 Modelling studies of cardiohemic vibratory system imply presence of vibrations due to blood‐pool deceleration in all hearts.21 With stiffer ventricles, restrictive early filling and shorter and sharper decelerations in HF, these vibrations are believed to assume sufficient enough energy in the audible range to be heard with a stethoscope.21, 23 In canine experiments, Ozawa et al.22 have demonstrated the existence of audible and sub‐audible (infrasonic) S3 components and have shown that their amplitudes are related. Furthermore, the ability of S3 to discriminate between HF and normal subjects is augmented by the inclusion of sub‐audible components.15 The results of this study indicate that S3 amplitude measured from the implanted cardiac devices may provide an objective measure of elevated filling pressure, as indicated by its significant correlation to LAP, without an additional surgery or procedure for a dedicated intravascular sensor implant and without the constraints of human audibility imposed by auscultation.
First heart sound, heart sound‐based systolic time interval, contractility, and heart failure
In the absence of an adequate compensation, a reduced contractility results in impaired stroke volume and low perfusion. Although studies looking at evolution of contractility leading up to worsening HF are lacking, there is evidence that contractility may be depressed when patients are hospitalized for HF. Numerous studies have shown that a significant proportion of patients hospitalized for decompensated HF have an elevated troponin concentration indicating myocardial injury.24 A significant number of patients with either ischaemic or non‐ischaemic cardiomyopathy with reduced systolic function have viable but non‐contractile or dysfunctional myocardium,25 which may be due to excessive neurohumoral stimulation, haemodynamic overload, and/or ischaemia.26 Depressed contractility in HF may be an important compensatory mechanism to reduce energy usage by the failing myocardium.27 In most patients with cardiac decompensation and low perfusion, the depressed cardiac function is a consequence of impaired myocardial contractility coupled with abnormal preload and afterload conditions.28 Compensatory mechanisms triggered to restore contractility following a primary event of myocardial infarction or cardiomyopathy result in a downward spiral of worsening preload and afterload conditions, myocardial injury, and further decrease in contractility, culminating in a low cardiac output and impaired organ perfusion.28
Prior studies have demonstrated the acute relationship of S1 amplitude with LV dP/dtmax as a surrogate for LV contractility.11 Our study suggests that the haemodynamic association is preserved in spite of the unconventional sensor location and the use of accelerometer embedded within an implanted cardiac device to measure HSs.
The STIs measured externally using a simultaneous phonocardiogram, surface electrocardiogram, and carotid pressure tracing were studied extensively in the 1960s and 1970s.14 Prior studies have shown that STIs measured exclusively using HSTIs without a simultaneous carotid pulse tracing bear a consistent relationship to true STIs.8, 29 Just like with true STIs,13 our results show a significant negative correlation of contractility to HSPEP and HSPEP/HSET, but poorer correlation to HSET.13 Together with S1 amplitude, HSTIs may track contractile function from an implanted device providing an ideal complement to congestion sensors such as impedance and S3 amplitude in monitoring of ambulatory HF patients.
Implications for chronic monitoring of heart failure patients
Given the complex pathophysiology of HF, there are substantial variations in the manifestations of any particular sign or symptom across patients and hospitalizations. Thus, a single sensor that targets one specific sign or symptom is likely to be inadequate to assess patients' clinical status. This is also consistent with clinical practice where no single sign or symptom is interpreted in isolation but in the context of all available clinical data. This may partly explain why single sensors that target individual sign or symptom, such as impedance for volume status, and minute ventilation and activity for exertion dyspnoea have had modest performance.30, 31, 32 A Heart Sound sensor provides an opportunity to target multiple aspects of HF pathophysiology given the differential haemodynamic correlates of various HS amplitude and timing parameters. The HS measured using an existing accelerometer within the implanted cardiac devices may aid in building a more holistic picture of patients clinical status without additional hardware or surgery. A multi‐sensor algorithm that incorporated such device‐based HS signals from existing accelerometer in conjunction with other device‐based sensors was recently shown to detect worsening HF events in ambulatory patients with high sensitivity.33
Cardiac valvular diseases, common co‐morbid conditions with a prevalence of 21–22% in HF patients,34 are known to impact S1 and S2 intensities.35 In these patients, chronic changes in S1 amplitude may be reflective of changes in HF status only as long as their valvular disease status remains substantially unchanged.
Conclusions
Accelerometer‐based HSs metrics (S1, pre‐ejection period, pre‐ejection period/ejection time) from an implanted device are significantly correlated to LV dP/dtmax in an acute myocardial ischaemia model and may serve as useful indicators of cardiac contractility. Accelerometer‐based S3 amplitude from an implanted device obtained during a canine pulmonary oedema induction model is significantly correlated to LAP. Additional research is warranted to evaluate the clinical utility of continuous ambulatory monitoring of implanted accelerometer‐based HSs amplitudes and timing intervals for human HF management applications.
Conflict of interest
Dr Gardner is a consultant for Boston Scientific. Drs Thakur, An, Swanson, and Zhang are employees of Boston Scientific.
Funding
This study was sponsored by Boston Scientific.
Thakur, P. H. , An, Q. , Swanson, L. , Zhang, Y. , and Gardner, R. S. (2017) Haemodynamic monitoring of cardiac status using heart sounds from an implanted cardiac device. ESC Heart Failure, 4: 605–613. doi: 10.1002/ehf2.12171.
Institution where work was performed: Boston Scientific, St Paul, Minnesota, USA.
References
- 1. Nohria A, Tsang SW, Fang JC, Lewis EF, Jarcho JA, Mudge GH, Stevenson LW. Clinical assessment identifies hemodynamic profiles that predict outcomes in patients admitted with heart failure. J Am Coll Cardiol 2003; 41: 1797–1804. [DOI] [PubMed] [Google Scholar]
- 2. Heidenreich PA, Ruggerio CM, Massie BM. Effect of a home monitoring system on hospitalization and resource use for patients with heart failure. Am Heart J 1999; 138: 633–640. [DOI] [PubMed] [Google Scholar]
- 3. Adamson PB. Using cardiac resynchronization therapy diagnostics for monitoring heart failure patients. Heart Fail Clin 2009; 5: 249–260. [DOI] [PubMed] [Google Scholar]
- 4. Abraham WT, Adamson PB, Bourge RC, Aaron MF, Costanzo MR, Stevenson LW, Strickland W, Neelagaru S, Raval N, Krueger S, Weiner S, Shavelle D, Jeffries B, Yadav JS. Wireless pulmonary artery haemodynamic monitoring in chronic heart failure: a randomised controlled trial. Lancet 2011; 377: 658–666. [DOI] [PubMed] [Google Scholar]
- 5. Mehta NJ, Khan IA. Third heart sound: genesis and clinical importance. Int J Cardiol 2004; 97: 183–186. [DOI] [PubMed] [Google Scholar]
- 6. Drazner MH, Rame JE, Stevenson LW, Dries DL. Prognostic importance of elevated jugular venous pressure and a third heart sound in patients with heart failure. N Engl J Med 2001; 345: 574–581. [DOI] [PubMed] [Google Scholar]
- 7. Marcus GM, Gerber IL, McKeown BH, Vessey JC, Jordan MV, Huddleston M, McCulloch CE, Foster E, Chatterjee K, Michaels AD. Association between phonocardiographic third and fourth heart sounds and objective measures of left ventricular function. JAMA 2005; 293: 2238–2244. [DOI] [PubMed] [Google Scholar]
- 8. Shah SJ, Michaels AD. Hemodynamic correlates of the third heart sound and systolic time intervals. Congest Heart Fail 2006; 12(Suppl 1): 8–13. [DOI] [PubMed] [Google Scholar]
- 9. Opasich C, Tavazzi L, Lucci D, Gorini M, Albanese MC, Cacciatore G, Maggioni AP. Comparison of one‐year outcome in women versus men with chronic congestive heart failure. Am J Cardiol 2000; 86: 353–357. [DOI] [PubMed] [Google Scholar]
- 10. Kono T, Rosman H, Alam M, Stein PD, Sabbah HN. Hemodynamic correlates of the third heart sound during the evolution of chronic heart failure. J Am Coll Cardiol 1993; 21: 419–423. [DOI] [PubMed] [Google Scholar]
- 11. Sakamoto T, Kusukawa R, Maccanon DM, Luisada AA. Hemodynamic determinants of the amplitude of the first heart sound. Circ Res 1965; 16: 45–57. [DOI] [PubMed] [Google Scholar]
- 12. Efstratiadis S, Michaels AD. Computerized acoustic cardiographic electromechanical activation time correlates with invasive and echocardiographic parameters of left ventricular contractility. J Card Fail 2008; 14: 577–582. [DOI] [PubMed] [Google Scholar]
- 13. Ahmed SS, Levinson GE, Schwartz CJ, Ettinger PO. Systolic time intervals as measures of the contractile state of the left ventricular myocardium in man. Circulation 1972; 46: 559–571. [DOI] [PubMed] [Google Scholar]
- 14. Lewis RP, Rittogers SE, Froester WF, Boudoulas H. A critical review of the systolic time intervals. Circulation 1977; 56: 146–158. [DOI] [PubMed] [Google Scholar]
- 15. Siejko KZ, Thakur PH, Maile K, Patangay A, Olivari MT. Feasibility of heart sounds measurements from an accelerometer within an ICD pulse generator. Pacing and Clinical Electrophysiology : PACE 2013; 36: 334–346. [DOI] [PubMed] [Google Scholar]
- 16. Guyton AC, Lindsey AW. Effect of elevated left atrial pressure and decreased plasma protein concentration on the development of pulmonary edema. Circ Res 1959; 7: 649–657. [DOI] [PubMed] [Google Scholar]
- 17. Ritzema J, Troughton R, Melton I, Crozier I, Doughty R, Krum H, Walton A, Adamson P, Kar S, Shah PK, Richards M, Eigler NL, Whiting JS, Haas GJ, Heywood JT, Frampton CM, Abraham WT. Physician‐directed patient self‐management of left atrial pressure in advanced chronic heart failure. Circulation 2010; 121: 1086–1095. [DOI] [PubMed] [Google Scholar]
- 18. Verdejo HE, Castro PF, Concepcion R, Ferrada MA, Alfaro MA, Alcaino ME, Deck CC, Bourge RC. Comparison of a radiofrequency‐based wireless pressure sensor to Swan‐Ganz catheter and echocardiography for ambulatory assessment of pulmonary artery pressure in heart failure. J Am Coll Cardiol 2007; 50: 2375–2382. [DOI] [PubMed] [Google Scholar]
- 19. Ponikowski P, Voors AA, Anker SD, Bueno H, Cleland JG, Coats AJ, Falk V, Gonzalez‐Juanatey JR, Harjola VP, Jankowska EA, Jessup M, Linde C, Nihoyannopoulos P, Parissis JT, Pieske B, Riley JP, Rosano GM, Ruilope LM, Ruschitzka F, Rutten FH, van der Meer P. ESC guidelines for the diagnosis and treatment of acute and chronic heart failure: the task force for the diagnosis and treatment of acute and chronic heart failure of the European Society of Cardiology (ESC) developed with the special contribution of the Heart Failure Association (HFA) of the ESC. Eur Heart J 2016; 37: 2129–2200. [DOI] [PubMed] [Google Scholar]
- 20. Van de Werf F, Minten J, Carmeliet P, De Geest H, Kesteloot H. The genesis of the third and fourth heart sounds. A pressure‐flow study in dogs. J Clin Invest 1984; 73: 1400–1407. [DOI] [PMC free article] [PubMed] [Google Scholar]
- 21. Manson AL, Nudelman SP, Hagley MT, Hall AF, Kovacs SJ. Relationship of the third heart sound to transmitral flow velocity deceleration. Circulation 1995; 92: 388–394. [DOI] [PubMed] [Google Scholar]
- 22. Ozawa Y, Smith D, Craige E. Origin of the third heart sound. I. Studies in dogs. Circulation 1983; 67: 393–398. [DOI] [PubMed] [Google Scholar]
- 23. Van de Werf F, Boel A, Geboers J, Minten J, Willems J, De Geest H, Kesteloot H. Diastolic properties of the left ventricle in normal adults and in patients with third heart sounds. Circulation 1984; 69: 1070–1078. [DOI] [PubMed] [Google Scholar]
- 24. Peacock WF, De Marco T, Fonarow GC, Diercks D, Wynne J, Apple FS, Wu AH. Cardiac troponin and outcome in acute heart failure. N Engl J Med 2008; 358: 2117–2126. [DOI] [PubMed] [Google Scholar]
- 25. Bayeva M, Sawicki KT, Butler J, Gheorghiade M, Ardehali H. Molecular and cellular basis of viable dysfunctional myocardium. Circ Heart Fail 2014; 7: 680–691. [DOI] [PMC free article] [PubMed] [Google Scholar]
- 26. Gheorghiade M, De Luca L, Fonarow GC, Filippatos G, Metra M, Francis GS. Pathophysiologic targets in the early phase of acute heart failure syndromes. Am J Cardiol 2005; 96: 11G–17G. [DOI] [PubMed] [Google Scholar]
- 27. Katz AM. A new inotropic drug: its promise and a caution. N Engl J Med 1978; 299: 1409–1410. [DOI] [PubMed] [Google Scholar]
- 28. Campia U, Nodari S, Gheorghiade M. Acute heart failure with low cardiac output: can we develop a short‐term inotropic agent that does not increase adverse events? Curr Heart Fail Rep 2010; 7: 100–109. [DOI] [PubMed] [Google Scholar]
- 29. Donal E, Giorgis L, Cazeau S, Leclercq C, Senhadji L, Amblard A, Jauvert G, Burban M, Hernandez A, Mabo P. Endocardial acceleration (sonr) vs. ultrasound‐derived time intervals in recipients of cardiac resynchronization therapy systems. Europace : European pacing, arrhythmias, and cardiac electrophysiology : journal of the working groups on cardiac pacing, arrhythmias, and cardiac cellular electrophysiology of the European Society of Cardiology 2011; 13: 402–408. [DOI] [PubMed] [Google Scholar]
- 30. Conraads VM, Tavazzi L, Santini M, Oliva F, Gerritse B, Yu CM, Cowie MR. Sensitivity and positive predictive value of implantable intrathoracic impedance monitoring as a predictor of heart failure hospitalizations: the sense‐HF trial. Eur Heart J 2011; 32: 2266–2273. [DOI] [PubMed] [Google Scholar]
- 31. Heist EK, Herre JM, Binkley PF, Van Bakel AB, Porterfield JG, Porterfield LM, Qu F, Turkel M, Pavri BB. Analysis of different device‐based intrathoracic impedance vectors for detection of heart failure events (from the detect fluid early from intrathoracic impedance monitoring study). Am J Cardiol 2014; 114: 1249–1256. [DOI] [PubMed] [Google Scholar]
- 32. Auricchio A, Gold MR, Brugada J, Nolker G, Arunasalam S, Leclercq C, Defaye P, Calo L, Baumann O, Leyva F. Long‐term effectiveness of the combined minute ventilation and patient activity sensors as predictor of heart failure events in patients treated with cardiac resynchronization therapy: results of the clinical evaluation of the physiological diagnosis function in the paradym CRT device trial (clepsydra) study. Eur J Heart Fail 2014; 16: 663–670. [DOI] [PubMed] [Google Scholar]
- 33. Boehmer JP, Hariharan R, Devecchi FG, Smith AL, Molon G, Capucci A, An Q, Averina V, Stolen CM, Thakur PH, Thompson JA, Wariar R, Zhang Y, Singh JP. A multisensor algorithm predicts heart failure events in patients with implanted devices: results from the multisense study. JACC Heart Failure 2017; 5: 216–225. [DOI] [PubMed] [Google Scholar]
- 34. Yancy CW, Lopatin M, Stevenson LW, De Marco T, Fonarow GC. Clinical presentation, management, and in‐hospital outcomes of patients admitted with acute decompensated heart failure with preserved systolic function: a report from the acute decompensated heart failure national registry (adhere) database. J Am Coll Cardiol 2006; 47: 76–84. [DOI] [PubMed] [Google Scholar]
- 35. Carabello BA, Crawford FA Jr. Valvular heart disease. N Engl J Med 1997; 337: 32–41. [DOI] [PubMed] [Google Scholar]


