
Figure 5.
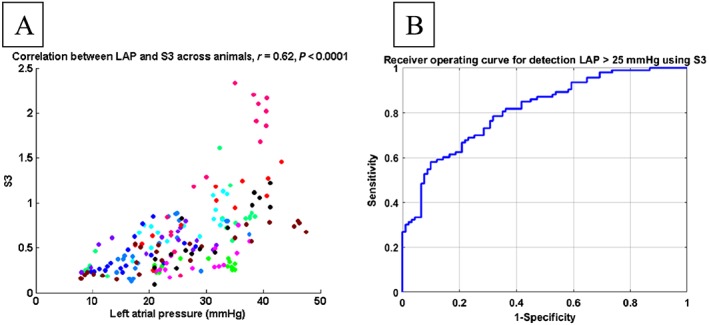
Correlation between third heart sound (S3) and left atrial pressure (LAP) (each colour represents data from one animal) after adjusting for physiological delay (A) and receiver operating curve for detecting elevated LAP using S3 (B).
Official websites use .gov
A
.gov website belongs to an official
government organization in the United States.
Secure .gov websites use HTTPS
A lock (
) or https:// means you've safely
connected to the .gov website. Share sensitive
information only on official, secure websites.
Correlation between third heart sound (S3) and left atrial pressure (LAP) (each colour represents data from one animal) after adjusting for physiological delay (A) and receiver operating curve for detecting elevated LAP using S3 (B).