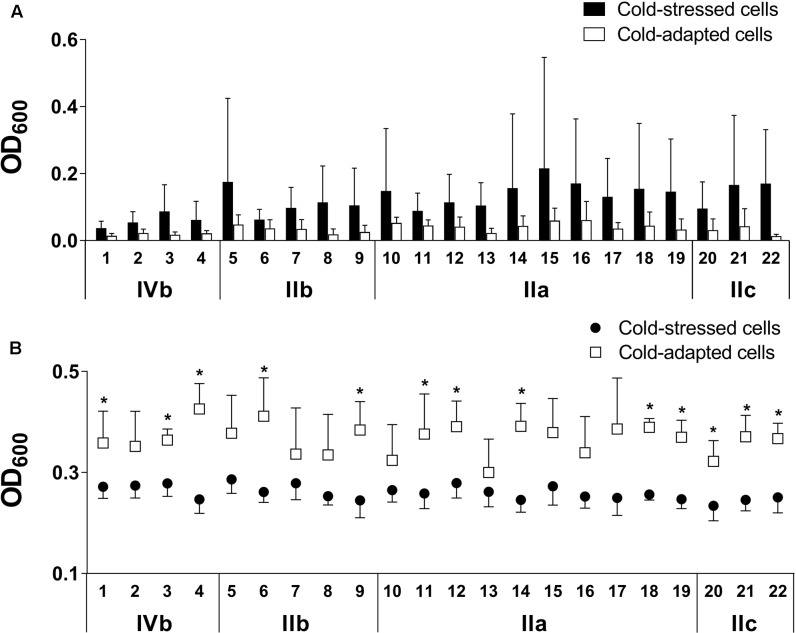
FIGURE 3.
Cold-stressed cells form more biomass than cold-adapted cells (A), while cold-adapted cells exceed total cell densities (B) as assessed using microtiter plate assay (MPA). Adherent cells are quantified by CV staining (A), and total cell densities combining planktonic and sessile cells are measured based on the turbidity of wells (B). Strains and serogroups are indicated on the X-axis, and data are presented as the mean ± standard deviation. ∗p < 0.05.

