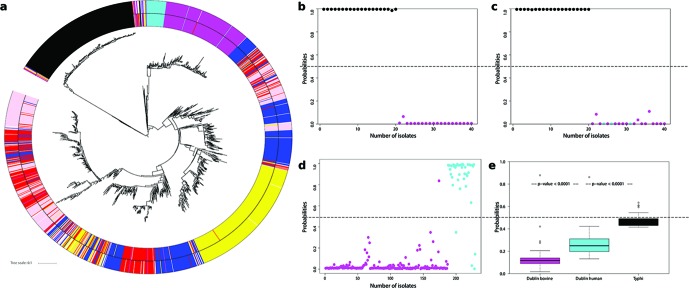
Fig. 1.
Host association of Salmonella enterica. Colour scheme of serovars: Typhi (black); Dublin-bovine (magenta); Dublin-human (cyan); STm avian (yellow); STm bovine (red); STm human (blue); STm swine (pink). (a) Clustering of isolates based on accessory genome content (non-core): distinct branches are evident for Typhi and Dublin serovars. Inside of STm there is some clustering associated with host; the majority of avian isolates cluster together, 80 % of the human isolates cluster in three groups, while the bovine and swine isolates are mostly found in groups of mixed origin. The outer ring shows the SVM host prediction when >0.5 (see Methods) and is otherwise left blank. (b) SVM prediction of Salmonella Typhi (human) vs serovar Dublin (bovine). Twenty isolates were randomly taken from each serovar for testing, and the model was trained on the remaining sequences (230 Typhi-human, 167 Dublin-bovine). Prediction was 100 % accurate due to highly discriminatory PVs (∆PV90=1349, ∆PV100=8). (c) The SVM classifier in (b) was applied to serovar Dublin isolates from both cattle (magenta) and humans (cyan): this primarily discriminates the serovar not the host as there is still complete separation between Typhi (black) and Dublin serovars (cyan and magenta). (d) If predictions were based on training with only Dublin human and bovine information then the Dublin isolates can be separated by this classification. (e) In this case STm bovine and human isolates were used as the training sets and testing was carried out on the distinct serovars: Dublin-bovine, Dublin-human and Typhi-human. Notably, the three groups can now be separated by the STm classifier in a logical trend based on isolation host.

