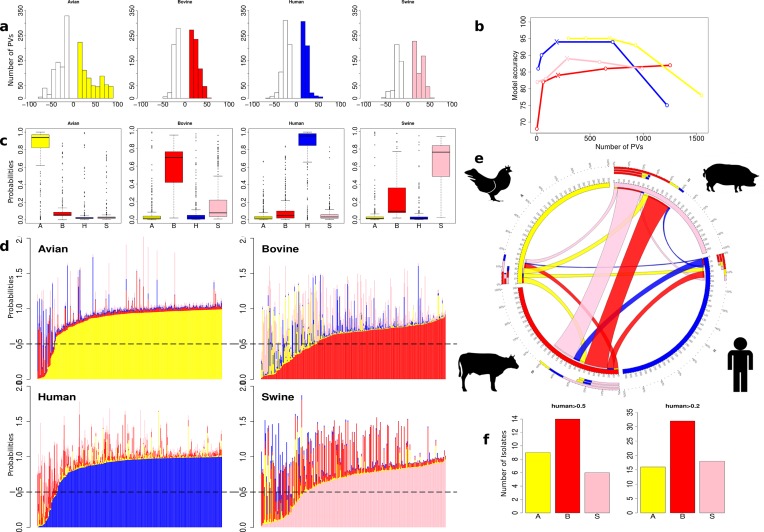
Fig. 2.
Host prediction by SVM for STm. Colour scheme: STm-avian (yellow); STm-bovine (red); STm-human (blue); STm-swine (pink). (a) The number of and differential PVs on which predictions were based for each host. PVs that differed by less than 10 are not shown (see Methods). The coloured bars are the number of PVs that are present in higher levels in the specified host group, while white bars are the number of PVs more abundant in the ‘all other’ population. (b) Graph showing the relationship between the number of PVs and model accuracy for each host group. Individual points relate to the number of PVs at different ∆PV thresholds from ∆PV>10 to ∆PV>50, plotted from right to left. Crosses define the number of PVs and model accuracy at ∆PV>30, which was applied in the study. (c) Probability assignments of isolate genome content to each host. All STm isolates were tested for their score assignment to each host, expressed as a probability. The sources of the majority of the isolates were predicted correctly, although some hosts have isolates that were more likely to contain genetic information that overlapped with another host. (d) SVM-assigned probabilities for each host plotted for each isolate as a stacked bar. This allows a comparison of the level of host specificity for each isolate. (e) Circos plot depicting the proportion of STm sequence features from each host that can be found in another host. For example, 51 swine isolates with strong porcine prediction scores (>0.5) also had high (>0.5) scores for genetic features from bovine isolates and these are shown as a pink ribbon going from the swine host to bovine host. In total, 52 bovine isolates had a high (>0.5) swine signal and are depicted with a red ribbon going from cattle to swine. The outer ring plots these data as the percentage of isolates assigned other host scores for each specific host. (f) STm isolates scored as human from the different hosts. For each STm isolate the probability of belonging to the human training group was assessed. With a threshold probability of 0.5, there were: nine avian (3 %), 14 bovine (5 %) and six swine (2 %) isolates. When the threshold was set at 0.2, there were 16 avian (5 %), 32 bovine (11 %) and 18 swine (7 %). At this threshold the higher proportion of cattle isolates with human isolate features is significant (Fisher’s exact test: P=0.035).

