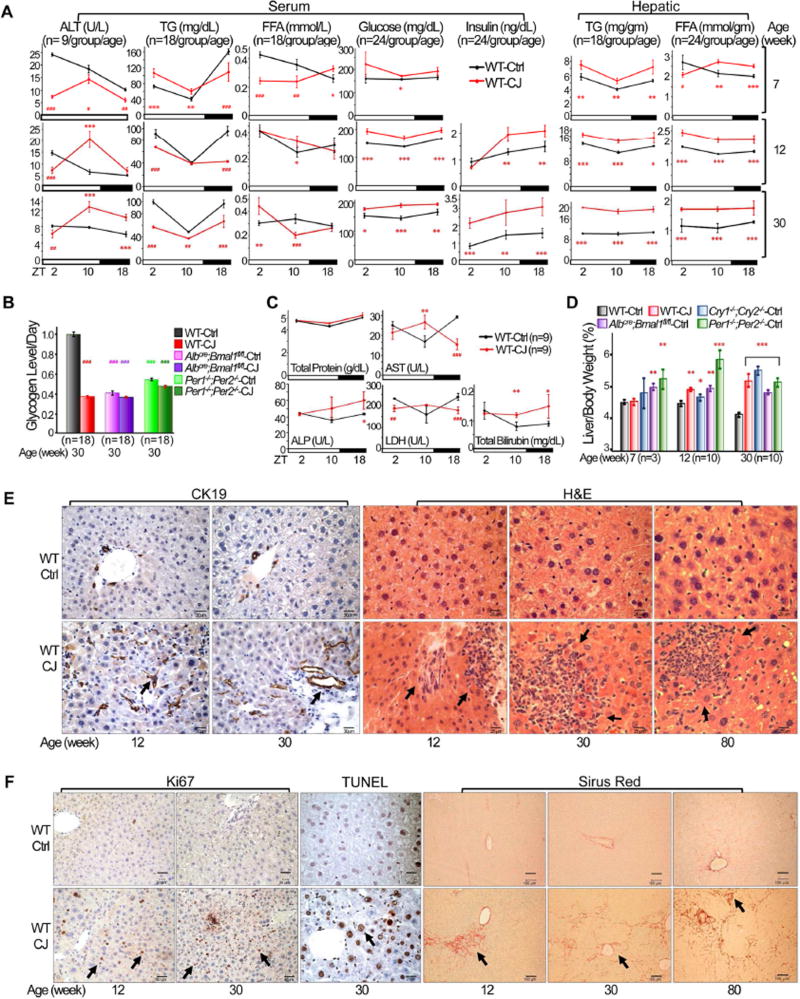
Figure 2. Chronic jet lag induces metabolic syndrome and the progression from NAFLD to NASH and fibrosis.
(A) The levels of serum and hepatic biomarkers in control and jet-lagged WT mice. ALT: alanine aminotransferase; TG: triglycerides; FFA: free fatty acids (Student t test). (B) Daily hepatic glycogen storage detected by Periodic Acid Schiff (PAS) staining in control and jetlagged WT mice. Values indicate average levels of glycogen storage detected at ZT2, 10 and 18 for each mouse model, with that in control WT mice as the arbitrary unit 1 (Image J/Color Deconvolution plugin quantification). (C) Serum liver biomarkers in 12 week old jet-lagged WT mice. AST: aspartate transaminase, ALP: alkaline phosphatase, LDH: lactate dehydrogenase (Student t test). (D) The ratios of liver vs body weight of circadian gene mutant and WT mice (Student t test). (E) Cytokeratin 19 (CK19) and H&E staining show incidence of intrahepatic bile duct proliferation and inflammation in control and jet-lagged WT mice. Arrows indicate representative proliferating bile ducts (CK19) and areas of hematopoietic cell infiltration (H&E). (F) Ki67, TUNEL and Sirus Red staining show incidence of hepatocyte proliferation and death, and liver fibrosis in control and jet-lagged WT mice. Arrows indicate representative Ki67+ or TUNEL+ hepatocytes (Ki67 or TUNEL), and liver fibrosis (Sirus Red). Scale bars are 60 µm (CK19), 50 µm (HE), 60 µm (Ki67), 50 µm (TUNEL) and 100 µm (Sirus Red) in correspondent slides. *: Increase,#: decrease, comparing to WT controls at the same time or age */#p<0.05, **/##p<0.01; ***/###p<0.001, ±SEM. See also figures S2 and S3.

