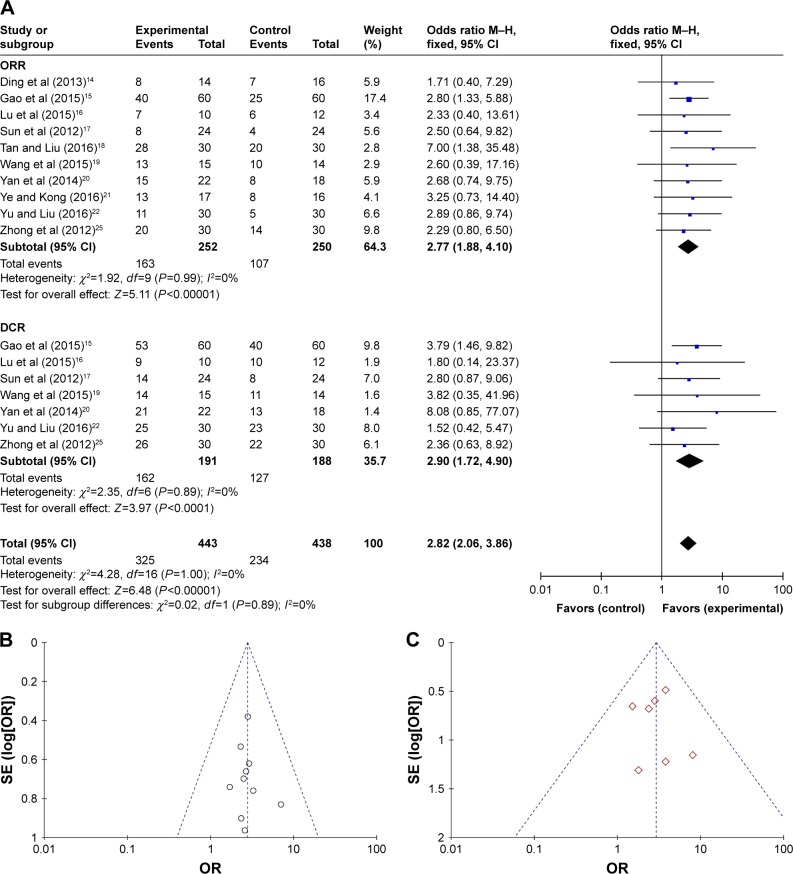
Figure 2.
(A) Forest plot of the comparison of ORR and DCR between the experimental and control groups. (B) Funnel plot of ORR. (C) Funnel plot of DCR. Control group, chemotherapy alone group; experimental group, chemotherapy plus DC–CIK immunotherapy. The fixed-effects meta-analysis model (Mantel–Haenszel method) was used.
Abbreviations: CI, confidence interval; DC–CIK, dendritic cells and cytokine-induced killer cells; DCR, disease control rate; IV, inverse variance; M–H, Mantel–Haenszel test; OR, odds ratio; ORR, overall response rate; SE, standard error.

