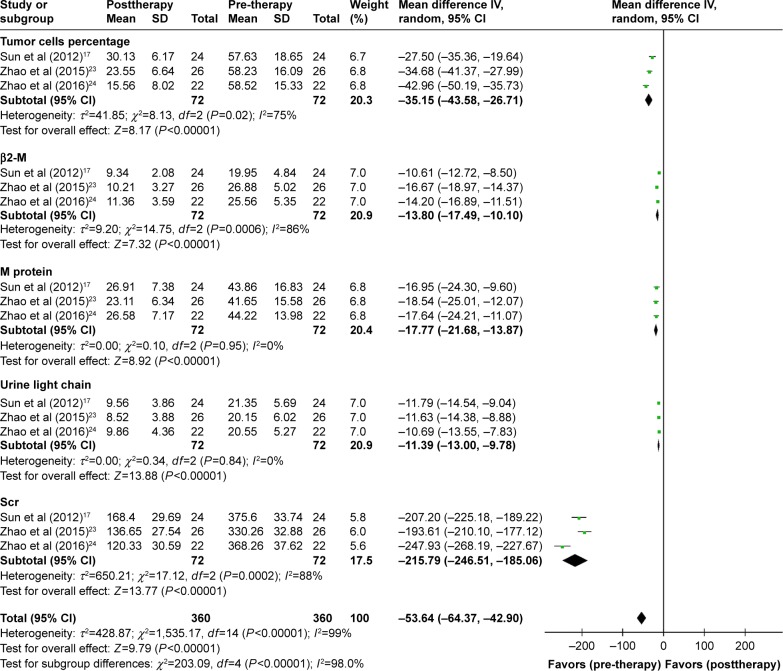
Figure 3.
Forest plot of the comparison of percentage of tumor cells, serum level of β2-M, serum level of M protein, 24 h urine light chain content, and Scr level between the experimental and control groups. Control group, chemotherapy alone group; experimental group, chemotherapy plus DC–CIK immunotherapy. The random effects meta-analysis model (inverse variance method) was used.
Abbreviations: CI, confidence interval; DC–CIK, dendritic cells and cytokine-induced killer cells; β2-M, β2-microglobin; IV, inverse variance; Scr, serum creatinine.

